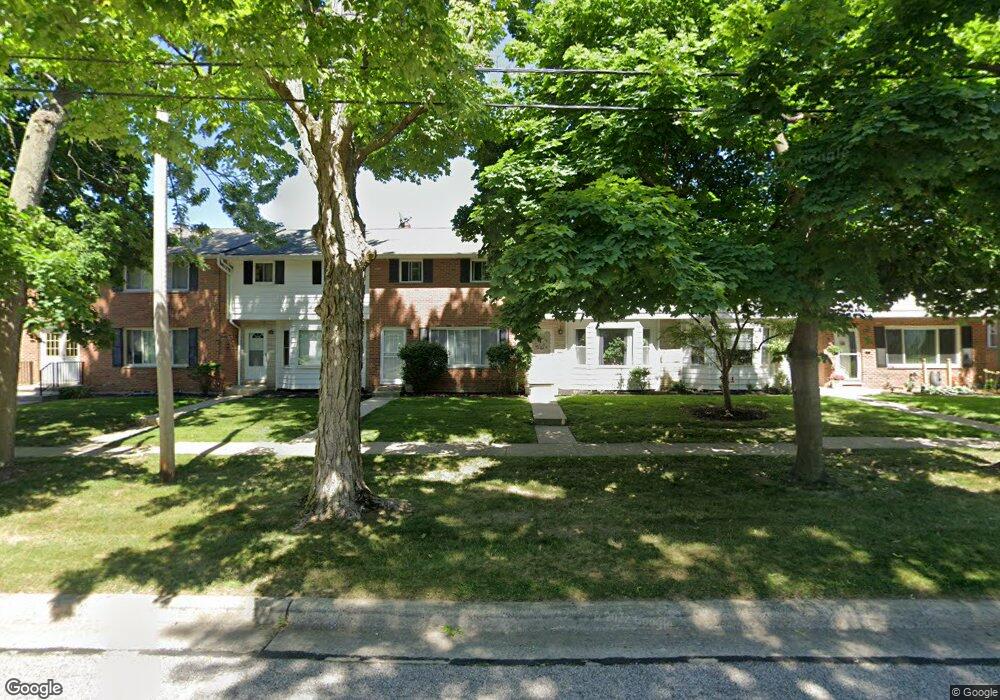
27651 Lake Shore Blvd Unit A7 Euclid, OH 44132
Estimated Value: $78,000 - $109,000
2
Beds
2
Baths
1,196
Sq Ft
$75/Sq Ft
Est. Value
About This Home
This home is located at 27651 Lake Shore Blvd Unit A7, Euclid, OH 44132 and is currently estimated at $90,085, approximately $75 per square foot. 27651 Lake Shore Blvd Unit A7 is a home located in Cuyahoga County with nearby schools including Shoreview Elementary School, Euclid High School, and Ss. Robert & William Catholic School.
Ownership History
Date
Name
Owned For
Owner Type
Purchase Details
Closed on
May 27, 2011
Sold by
Fannie Mae
Bought by
Sanford Carolyn D
Current Estimated Value
Purchase Details
Closed on
Oct 20, 2010
Sold by
Faber Jennifer
Bought by
Federal National Mortgage Association
Purchase Details
Closed on
May 22, 2006
Sold by
Miles Cher H and Miles Donald P
Bought by
Deangelo Jennifer
Home Financials for this Owner
Home Financials are based on the most recent Mortgage that was taken out on this home.
Original Mortgage
$72,105
Interest Rate
6.56%
Mortgage Type
Fannie Mae Freddie Mac
Purchase Details
Closed on
Aug 7, 1987
Sold by
Oneill Hugh Kevin
Bought by
Marshall Cher H
Purchase Details
Closed on
Mar 3, 1987
Sold by
Oneill Oneill H H and Oneill B
Bought by
Oneill Hugh Kevin
Purchase Details
Closed on
Jan 1, 1979
Bought by
Oneill Oneill H and Oneill B
Create a Home Valuation Report for This Property
The Home Valuation Report is an in-depth analysis detailing your home's value as well as a comparison with similar homes in the area
Home Values in the Area
Average Home Value in this Area
Purchase History
| Date | Buyer | Sale Price | Title Company |
|---|---|---|---|
| Sanford Carolyn D | $28,000 | Accutitle Agency | |
| Federal National Mortgage Association | $23,334 | None Available | |
| Deangelo Jennifer | $75,900 | Executive Title Agency | |
| Marshall Cher H | $42,000 | -- | |
| Oneill Hugh Kevin | -- | -- | |
| Oneill Oneill H | -- | -- |
Source: Public Records
Mortgage History
| Date | Status | Borrower | Loan Amount |
|---|---|---|---|
| Previous Owner | Deangelo Jennifer | $72,105 |
Source: Public Records
Tax History Compared to Growth
Tax History
| Year | Tax Paid | Tax Assessment Tax Assessment Total Assessment is a certain percentage of the fair market value that is determined by local assessors to be the total taxable value of land and additions on the property. | Land | Improvement |
|---|---|---|---|---|
| 2024 | $1,894 | $28,175 | $2,835 | $25,340 |
| 2023 | $1,707 | $20,300 | $2,030 | $18,270 |
| 2022 | $1,667 | $20,300 | $2,030 | $18,270 |
| 2021 | $1,864 | $20,300 | $2,030 | $18,270 |
| 2020 | $1,454 | $14,390 | $1,440 | $12,950 |
| 2019 | $1,316 | $41,100 | $4,100 | $37,000 |
| 2018 | $1,113 | $14,390 | $1,440 | $12,950 |
| 2017 | $967 | $8,720 | $1,160 | $7,560 |
| 2016 | $969 | $8,720 | $1,160 | $7,560 |
| 2015 | $8,358 | $8,720 | $1,160 | $7,560 |
| 2014 | $7,495 | $17,430 | $2,310 | $15,120 |
Source: Public Records
Map
Nearby Homes
- 295 E 276th St
- 150 Westbrook Dr
- 27709 Parkwood Dr
- 557 Ezmor Ln
- 278 E 286th St
- 251 E 286th St
- 459 Lloyd Rd
- 335 Blissfield Dr
- 28805 Cresthaven Dr
- 369 E 270th St
- 28812 Cresthaven Dr
- 625 Lloyd Rd
- 445 E 275th St
- 29616 Grand Blvd
- 25801 Lake Shore Blvd Unit 23
- 25801 Lake Shore Blvd Unit 64
- 25801 Lake Shore Blvd Unit 130
- 25801 Lake Shore Blvd Unit 28
- 25801 Lakeshore Blvd Unit 42
- 440 E 271st St
- 27651 Lake Shore Blvd Unit B6
- 27651 Lake Shore Blvd Unit 6E
- 27651 Lake Shore Blvd Unit E-4
- 27651 Lake Shore Blvd Unit 1C
- 27651 Lake Shore Blvd Unit 5D
- 27651 Lake Shore Blvd Unit 10C
- 27651 Lake Shore Blvd Unit A3
- 27651 Lake Shore Blvd Unit 4D
- 27651 Lake Shore Blvd
- 27651 Lake Shore Blvd Unit 11C
- 27651 Lake Shore Blvd Unit B5
- 27651 Lake Shore Blvd Unit 2F
- 27651 Lake Shore Blvd Unit 5F
- 27651 Lake Shore Blvd Unit 12C
- 27651 Lake Shore Blvd Unit 8E
- 27651 Lake Shore Blvd
- 27651 Lake Shore Blvd Unit 5C
- 27651 Lake Shore Blvd Unit 7C
- 27651 Lake Shore Blvd
- 27651 Lake Shore Blvd