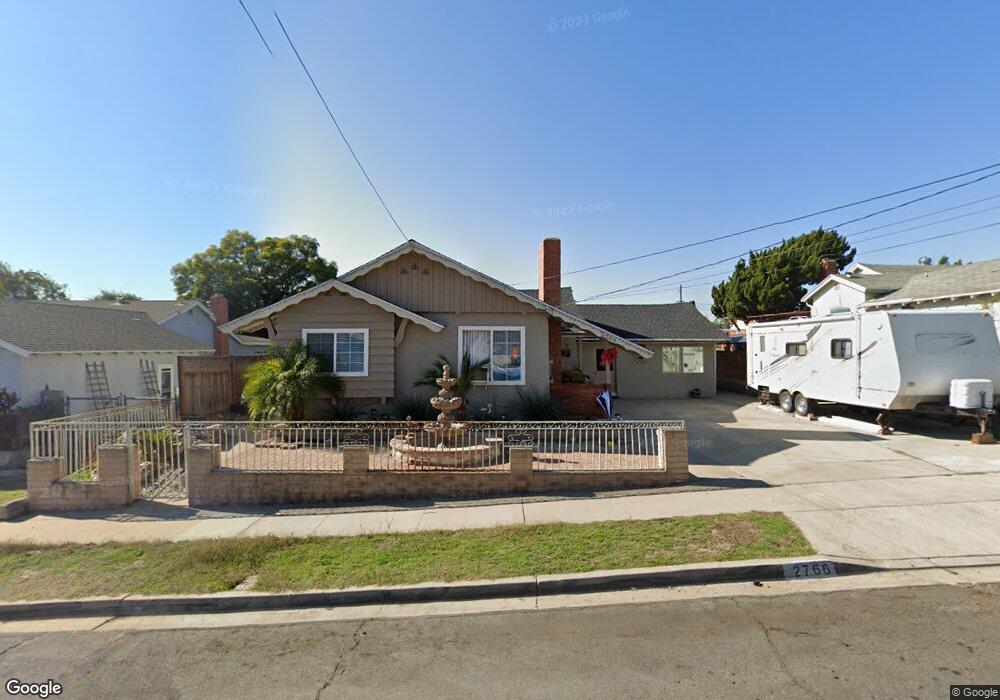
2766 Kausman St San Diego, CA 92139
Paradise Hills NeighborhoodEstimated Value: $662,000 - $786,000
3
Beds
2
Baths
968
Sq Ft
$737/Sq Ft
Est. Value
About This Home
This home is located at 2766 Kausman St, San Diego, CA 92139 and is currently estimated at $713,830, approximately $737 per square foot. 2766 Kausman St is a home located in San Diego County with nearby schools including Penn Elementary, Bell Middle School, and Morse High School.
Ownership History
Date
Name
Owned For
Owner Type
Purchase Details
Closed on
Feb 16, 2024
Sold by
Valverde Juan R and Valverde Ines C
Bought by
Valverde Juan R and Valverde Ines C
Current Estimated Value
Purchase Details
Closed on
Mar 8, 2002
Sold by
Walker Teresa and Carnes Charleen P
Bought by
Valverde Juan R and Valverde Ines C
Home Financials for this Owner
Home Financials are based on the most recent Mortgage that was taken out on this home.
Original Mortgage
$209,709
Interest Rate
6.84%
Mortgage Type
FHA
Purchase Details
Closed on
Jan 10, 1994
Sold by
Dziekan George C
Bought by
Dziekan George C
Purchase Details
Closed on
Jan 7, 1994
Sold by
Carnes Charleen P
Bought by
Dziekan George C
Purchase Details
Closed on
Sep 28, 1993
Sold by
Dewez Teresa
Bought by
Dziekan George Carl
Create a Home Valuation Report for This Property
The Home Valuation Report is an in-depth analysis detailing your home's value as well as a comparison with similar homes in the area
Home Values in the Area
Average Home Value in this Area
Purchase History
| Date | Buyer | Sale Price | Title Company |
|---|---|---|---|
| Valverde Juan R | -- | None Listed On Document | |
| Valverde Family Trust | -- | None Listed On Document | |
| Valverde Juan R | $213,000 | Commerce Title Company | |
| Dziekan George C | -- | -- | |
| Dziekan George C | -- | -- | |
| Dziekan George Carl | -- | -- |
Source: Public Records
Mortgage History
| Date | Status | Borrower | Loan Amount |
|---|---|---|---|
| Previous Owner | Valverde Juan R | $209,709 |
Source: Public Records
Tax History Compared to Growth
Tax History
| Year | Tax Paid | Tax Assessment Tax Assessment Total Assessment is a certain percentage of the fair market value that is determined by local assessors to be the total taxable value of land and additions on the property. | Land | Improvement |
|---|---|---|---|---|
| 2025 | $3,738 | $314,651 | $147,722 | $166,929 |
| 2024 | $3,738 | $308,482 | $144,826 | $163,656 |
| 2023 | $3,653 | $302,435 | $141,987 | $160,448 |
| 2022 | $3,554 | $296,505 | $139,203 | $157,302 |
| 2021 | $3,528 | $290,692 | $136,474 | $154,218 |
| 2020 | $3,485 | $287,712 | $135,075 | $152,637 |
| 2019 | $3,422 | $282,072 | $132,427 | $149,645 |
| 2018 | $3,198 | $276,542 | $129,831 | $146,711 |
| 2017 | $3,121 | $271,121 | $127,286 | $143,835 |
| 2016 | $3,069 | $265,806 | $124,791 | $141,015 |
| 2015 | $3,023 | $261,814 | $122,917 | $138,897 |
| 2014 | $2,974 | $256,687 | $120,510 | $136,177 |
Source: Public Records
Map
Nearby Homes
- 2745 Kausman St
- 6442 Seascape Dr
- 3161 Manos Dr
- 2754 Alta View Dr
- 2910 Lucia Jade Loop
- 6759 Parkside Ave
- 6127 Winchester St
- 6767 Parkside Ave
- 6795 Parkside Ave
- 6811 Parkside Ave
- 2951 Manos Dr
- 6872 Quebec Ct Unit 5
- 2579 Reo Dr
- 6968 Appian Dr
- 3010 Alta View Dr Unit 107
- 2588 Pennington Ln
- 2862 Callejon
- 7007 Appian Dr Unit B
- 5819 Roanoke St
- 7089 Wattle Dr
- 2756 Kausman St
- 2776 Kausman St
- 2741 Beatrice St
- 2731 Beatrice St
- 2751 Beatrice St
- 2746 Kausman St
- 2786 Kausman St
- 2721 Beatrice St
- 2775 Kausman St
- 2755 Kausman St
- 2761 Beatrice St
- 2711 Beatrice St
- 2736 Kausman St
- 2785 Kausman St
- 2732 Beatrice St
- 2742 Beatrice St
- 2701 Beatrice St
- 2718 Keen Dr
- 2726 Keen Dr
- 2726 Kausman St