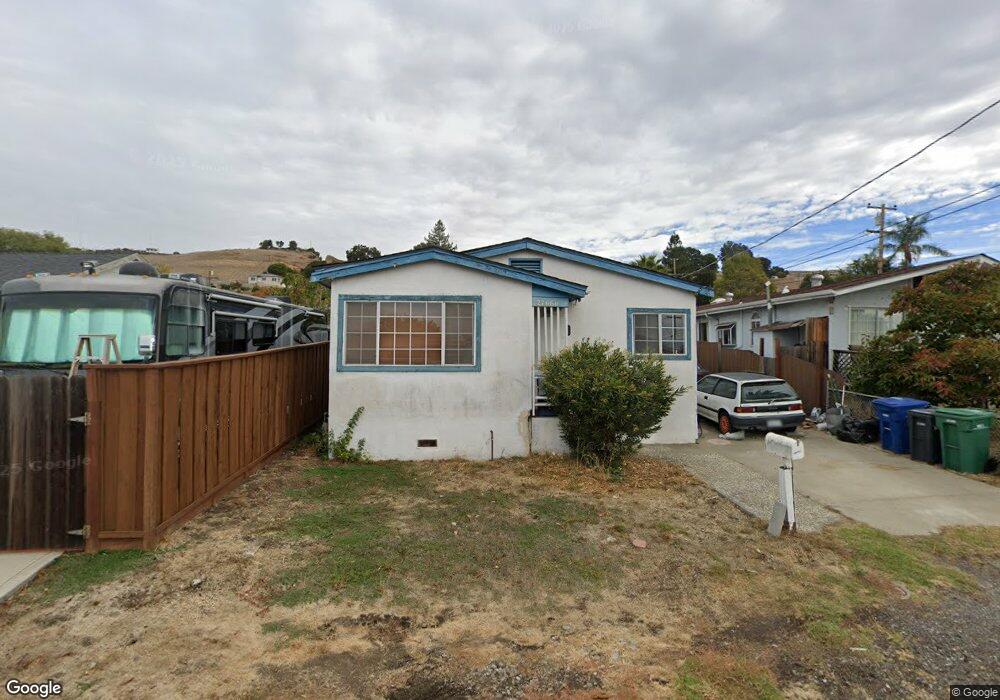
27660 E 15th St Hayward, CA 94544
Mission-Garin NeighborhoodEstimated Value: $586,000 - $701,000
3
Beds
1
Bath
840
Sq Ft
$785/Sq Ft
Est. Value
About This Home
This home is located at 27660 E 15th St, Hayward, CA 94544 and is currently estimated at $659,766, approximately $785 per square foot. 27660 E 15th St is a home located in Alameda County with nearby schools including Tyrrell Elementary School, Cesar Chavez Middle School, and Tennyson High School.
Ownership History
Date
Name
Owned For
Owner Type
Purchase Details
Closed on
Oct 11, 2000
Sold by
Dias Marvin L
Bought by
Robertson Carolyn
Current Estimated Value
Home Financials for this Owner
Home Financials are based on the most recent Mortgage that was taken out on this home.
Original Mortgage
$184,000
Outstanding Balance
$67,295
Interest Rate
7.96%
Mortgage Type
Stand Alone First
Estimated Equity
$592,471
Create a Home Valuation Report for This Property
The Home Valuation Report is an in-depth analysis detailing your home's value as well as a comparison with similar homes in the area
Home Values in the Area
Average Home Value in this Area
Purchase History
| Date | Buyer | Sale Price | Title Company |
|---|---|---|---|
| Robertson Carolyn | $184,000 | Old Republic Title Company |
Source: Public Records
Mortgage History
| Date | Status | Borrower | Loan Amount |
|---|---|---|---|
| Open | Robertson Carolyn | $184,000 |
Source: Public Records
Tax History
| Year | Tax Paid | Tax Assessment Tax Assessment Total Assessment is a certain percentage of the fair market value that is determined by local assessors to be the total taxable value of land and additions on the property. | Land | Improvement |
|---|---|---|---|---|
| 2025 | $3,514 | $270,237 | $83,171 | $194,066 |
| 2024 | $3,514 | $264,802 | $81,540 | $190,262 |
| 2023 | $3,462 | $266,474 | $79,942 | $186,532 |
| 2022 | $3,396 | $254,250 | $78,375 | $182,875 |
| 2021 | $3,367 | $249,127 | $76,838 | $179,289 |
| 2020 | $3,331 | $253,501 | $76,050 | $177,451 |
| 2019 | $3,884 | $248,531 | $74,559 | $173,972 |
| 2018 | $3,670 | $243,660 | $73,098 | $170,562 |
| 2017 | $3,576 | $238,883 | $71,665 | $167,218 |
| 2016 | $3,352 | $234,200 | $70,260 | $163,940 |
| 2015 | $2,963 | $230,684 | $69,205 | $161,479 |
| 2014 | $2,707 | $226,167 | $67,850 | $158,317 |
Source: Public Records
Map
Nearby Homes
- 744 Broadway St
- 27777 E 12th St
- 29710 Cantera Dr
- 28719 Vista Grande Dr
- 27260 Cosmo Ct
- 27277 Cosmo Ct
- 807 Maybeck Place
- 27261 Cosmo Ct
- 806 Maybeck Place
- 802 Maybeck Place
- 28731 Vista Grande Dr
- 27773 Pistachio Ct
- 27777 Pistachio Ct
- 28949 Parkridge Loop Unit 86
- 28954 Parkwood Ln Unit 66
- 28957 Ashwell Ave
- 28968 Parkridge Loop Unit 117
- 28961 Hideaway St
- 28315 Rochelle Ave
- 29803 Cantera Dr
- 27680 E 15th St
- 27640 E 15th St
- 808 Broadway St
- 819 Kellogg Ave
- 822 Broadway St
- 27742 E 15th St
- 837 Kellogg Ave
- Lot 10 Kellogg Ave
- Lot 11 Kellogg Ave
- 790 Broadway St
- 811 Broadway St
- 787 Kellogg Ave
- 817 Broadway St
- 27568 E 15th St
- 791 Broadway St
- 831 Broadway St
- 820 Kellogg Ave
- 838 Broadway St
- 861 Kellogg Ave
- 27768 E 15th St
Your Personal Tour Guide
Ask me questions while you tour the home.