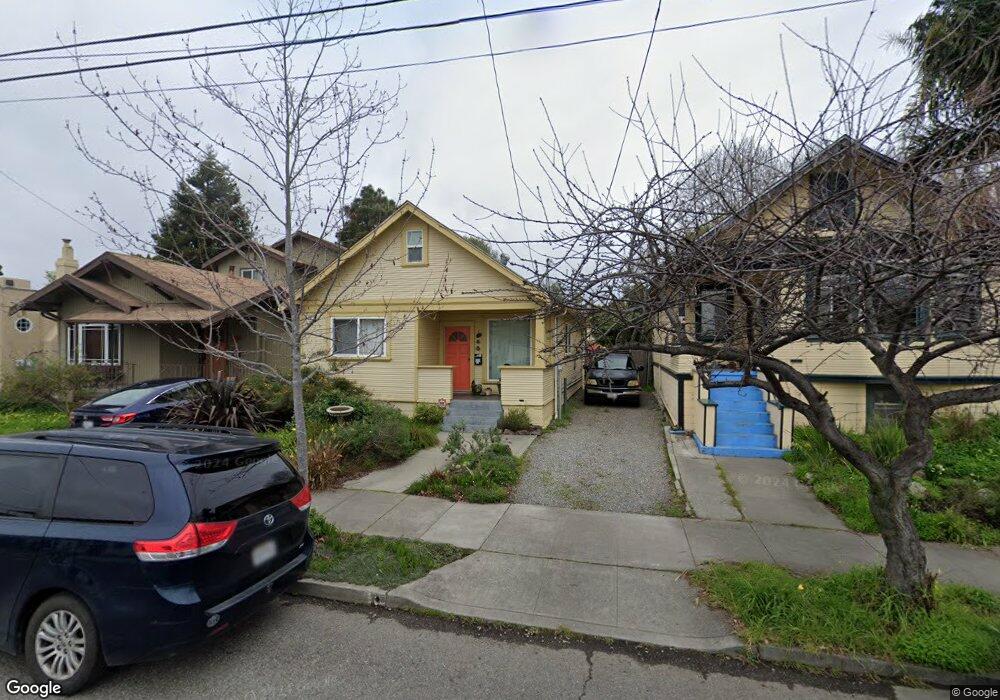
2767 Dohr St Berkeley, CA 94702
West Berkeley NeighborhoodEstimated Value: $835,000 - $1,053,000
3
Beds
2
Baths
956
Sq Ft
$996/Sq Ft
Est. Value
About This Home
This home is located at 2767 Dohr St, Berkeley, CA 94702 and is currently estimated at $952,472, approximately $996 per square foot. 2767 Dohr St is a home located in Alameda County with nearby schools including Malcolm X Elementary School, Washington Elementary School, and Oxford Elementary School.
Ownership History
Date
Name
Owned For
Owner Type
Purchase Details
Closed on
Sep 8, 2023
Sold by
Raingarden Cathleen
Bought by
Cathleen Raingarden Living Trust and Raingarden
Current Estimated Value
Purchase Details
Closed on
Apr 14, 2006
Sold by
Perry Joel and Perry Lorna
Bought by
Raingarden Cathy
Home Financials for this Owner
Home Financials are based on the most recent Mortgage that was taken out on this home.
Original Mortgage
$350,000
Interest Rate
6.35%
Mortgage Type
Fannie Mae Freddie Mac
Purchase Details
Closed on
Jul 9, 1997
Sold by
Dyer Brenda F
Bought by
Perry Joel and Perry Lorna
Home Financials for this Owner
Home Financials are based on the most recent Mortgage that was taken out on this home.
Original Mortgage
$136,963
Interest Rate
7.83%
Mortgage Type
FHA
Create a Home Valuation Report for This Property
The Home Valuation Report is an in-depth analysis detailing your home's value as well as a comparison with similar homes in the area
Home Values in the Area
Average Home Value in this Area
Purchase History
| Date | Buyer | Sale Price | Title Company |
|---|---|---|---|
| Cathleen Raingarden Living Trust | -- | None Listed On Document | |
| Raingarden Cathy | $510,000 | Alliance Title Company | |
| Perry Joel | $138,000 | Old Republic Title Company |
Source: Public Records
Mortgage History
| Date | Status | Borrower | Loan Amount |
|---|---|---|---|
| Previous Owner | Raingarden Cathy | $350,000 | |
| Previous Owner | Perry Joel | $136,963 |
Source: Public Records
Tax History
| Year | Tax Paid | Tax Assessment Tax Assessment Total Assessment is a certain percentage of the fair market value that is determined by local assessors to be the total taxable value of land and additions on the property. | Land | Improvement |
|---|---|---|---|---|
| 2025 | $9,955 | $676,229 | $209,068 | $474,161 |
| 2024 | $9,955 | $662,834 | $204,969 | $464,865 |
| 2023 | $9,751 | $656,704 | $200,951 | $455,753 |
| 2022 | $9,588 | $636,829 | $197,011 | $446,818 |
| 2021 | $9,614 | $624,209 | $193,150 | $438,059 |
| 2020 | $9,140 | $624,739 | $191,170 | $433,569 |
| 2019 | $8,824 | $612,494 | $187,423 | $425,071 |
| 2018 | $8,682 | $600,489 | $183,749 | $416,740 |
| 2017 | $8,366 | $588,719 | $180,148 | $408,571 |
| 2016 | $8,123 | $577,179 | $176,617 | $400,562 |
| 2015 | $8,018 | $568,514 | $173,965 | $394,549 |
| 2014 | $6,201 | $415,000 | $124,500 | $290,500 |
Source: Public Records
Map
Nearby Homes
- 2790 Sacramento St
- 2782 Sacramento St
- 2774 Sacramento St
- 2758 Sacramento St
- 1450 Ward St
- 2750 Sacramento St
- 2922 Stanton St
- 2717 Mabel St
- 1515 Derby St
- 2829 California St
- 1535 Julia St
- 1314 Ashby Ave
- 2751 Wallace St
- 1612 Carleton St
- 1237 Ashby Ave
- 1612 Parker St
- 1507 Prince St
- 3032 Mabel St
- 3101 Sacramento St
- 1646 Ashby Ave
Your Personal Tour Guide
Ask me questions while you tour the home.