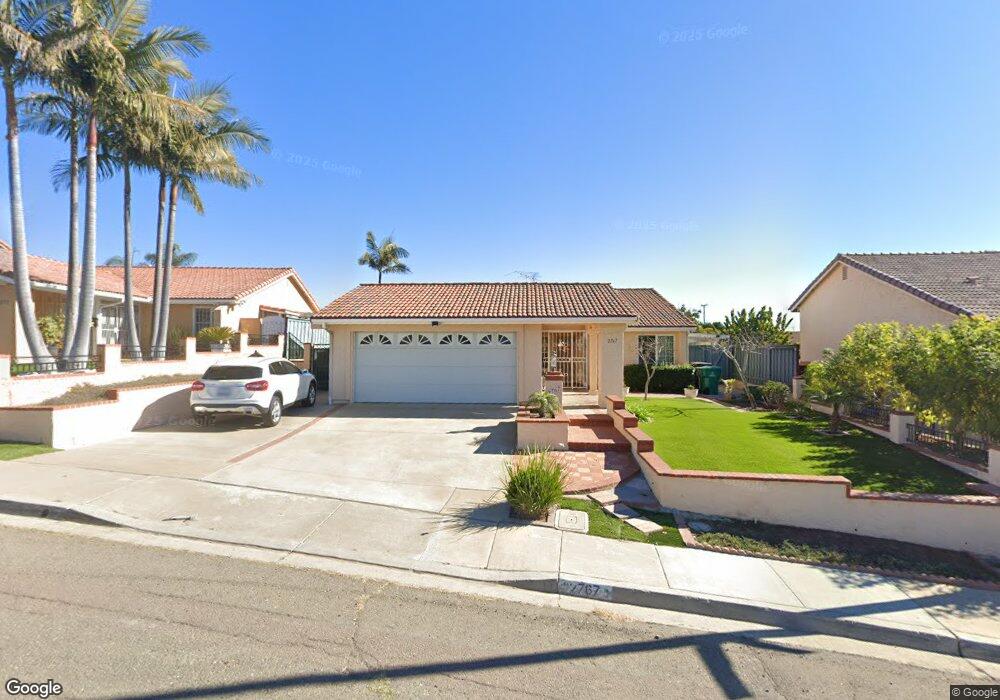
2767 Whitney St San Diego, CA 92111
Linda Vista NeighborhoodEstimated Value: $983,090 - $1,059,000
3
Beds
2
Baths
1,540
Sq Ft
$657/Sq Ft
Est. Value
About This Home
This home is located at 2767 Whitney St, San Diego, CA 92111 and is currently estimated at $1,012,523, approximately $657 per square foot. 2767 Whitney St is a home located in San Diego County with nearby schools including Linda Vista Elementary School, Montgomery Middle School, and San Diego Cooperative Charter School.
Ownership History
Date
Name
Owned For
Owner Type
Purchase Details
Closed on
Jan 10, 2022
Sold by
Truong Hoc V
Bought by
Vantruong Hoc and Lam Tam Thanh
Current Estimated Value
Purchase Details
Closed on
Feb 4, 2016
Sold by
Vanvantruong Hoc Van
Bought by
Truong Hoc
Home Financials for this Owner
Home Financials are based on the most recent Mortgage that was taken out on this home.
Original Mortgage
$412,500
Outstanding Balance
$327,119
Interest Rate
3.79%
Mortgage Type
New Conventional
Estimated Equity
$685,404
Purchase Details
Closed on
Apr 21, 2014
Sold by
H V T Realty Llc
Bought by
Vanvantruong Hoc Van
Purchase Details
Closed on
Feb 26, 2010
Sold by
Vantruong Hoc
Bought by
Hvt Realty Llc
Purchase Details
Closed on
Feb 23, 1993
Bought by
Vanvanvanvantruong Hoc Van
Purchase Details
Closed on
Jul 12, 1985
Create a Home Valuation Report for This Property
The Home Valuation Report is an in-depth analysis detailing your home's value as well as a comparison with similar homes in the area
Home Values in the Area
Average Home Value in this Area
Purchase History
| Date | Buyer | Sale Price | Title Company |
|---|---|---|---|
| Vantruong Hoc | -- | None Available | |
| Truong Hoc | -- | Orange Coast Title Company | |
| Vanvantruong Hoc Van | -- | None Available | |
| Hvt Realty Llc | -- | None Available | |
| Vanvanvanvantruong Hoc Van | $160,000 | -- | |
| -- | $116,000 | -- |
Source: Public Records
Mortgage History
| Date | Status | Borrower | Loan Amount |
|---|---|---|---|
| Open | Truong Hoc | $412,500 |
Source: Public Records
Tax History Compared to Growth
Tax History
| Year | Tax Paid | Tax Assessment Tax Assessment Total Assessment is a certain percentage of the fair market value that is determined by local assessors to be the total taxable value of land and additions on the property. | Land | Improvement |
|---|---|---|---|---|
| 2025 | $3,410 | $277,350 | $132,584 | $144,766 |
| 2024 | $3,410 | $271,913 | $129,985 | $141,928 |
| 2023 | $3,335 | $266,583 | $127,437 | $139,146 |
| 2022 | $3,246 | $261,357 | $124,939 | $136,418 |
| 2021 | $3,220 | $256,234 | $122,490 | $133,744 |
| 2020 | $3,178 | $253,608 | $121,235 | $132,373 |
| 2019 | $3,119 | $248,636 | $118,858 | $129,778 |
| 2018 | $2,919 | $243,762 | $116,528 | $127,234 |
| 2017 | $2,850 | $238,984 | $114,244 | $124,740 |
| 2016 | $2,800 | $234,299 | $112,004 | $122,295 |
| 2015 | $2,759 | $230,781 | $110,322 | $120,459 |
| 2014 | $2,717 | $226,261 | $108,161 | $118,100 |
Source: Public Records
Map
Nearby Homes
- 2767 Lancha St
- 7016 Park Mesa Way
- 6929 Park Mesa Way Unit 126
- 2675 Comstock St
- 7128 E Hyatt St
- 6728 Thomson Ct
- 6737 Thomson Ct
- 2818 Nye St
- 2868-70 Preece St
- 2249-51 W Dunlop St
- 7462 Hanford Place
- 2290 Hanford Dr
- 7555 Linda Vista Unit 9
- 7613 Family Cir Unit LU5
- 2216-18 Dunlop St
- 3014 Old Bridgeport Way
- 3047 Old Bridgeport Way
- 2525 Inman Ct
- 7855 Hummingbird Ln
- 2201-7 Burroughs St
- 2777 Whitney St
- 2757 Whitney St
- 2770 Lancha St
- 2760 Lancha St
- 2787 Whitney St
- 2780 Lancha St
- 7014 Ladrillo St
- 6996 Whitney Ct
- 7004 Ladrillo St
- 7024 Ladrillo St
- 7034 Ladrillo St
- 2790 Lancha St
- 7001 Wheatley St
- 7011 Wheatley St
- 6989 Whitney Ct
- 6986 Whitney Ct
- 7021 Wheatley St
- 6991 Wheatley St
- 7031 Wheatley St
- 6981 Wheatley St