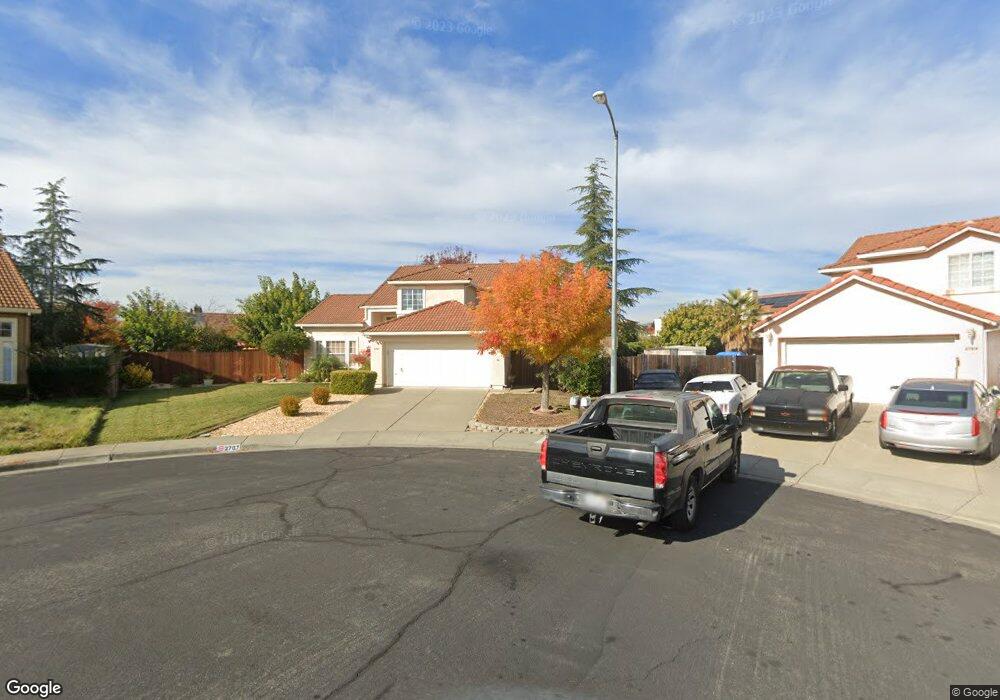
2767 Woodmont Ct Fairfield, CA 94533
Estimated Value: $567,000 - $640,000
3
Beds
3
Baths
1,967
Sq Ft
$303/Sq Ft
Est. Value
About This Home
This home is located at 2767 Woodmont Ct, Fairfield, CA 94533 and is currently estimated at $595,408, approximately $302 per square foot. 2767 Woodmont Ct is a home located in Solano County with nearby schools including Laurel Creek Elementary School, Grange Middle School, and Fairfield High School.
Ownership History
Date
Name
Owned For
Owner Type
Purchase Details
Closed on
Apr 23, 2015
Sold by
Good Dennis E
Bought by
Good Dennis E
Current Estimated Value
Home Financials for this Owner
Home Financials are based on the most recent Mortgage that was taken out on this home.
Original Mortgage
$158,350
Interest Rate
3.73%
Mortgage Type
New Conventional
Purchase Details
Closed on
Mar 12, 2012
Sold by
Good Dennis E
Bought by
Good Dennis E
Home Financials for this Owner
Home Financials are based on the most recent Mortgage that was taken out on this home.
Original Mortgage
$182,961
Interest Rate
3.5%
Mortgage Type
FHA
Purchase Details
Closed on
Apr 22, 2011
Sold by
Good Dennis E
Bought by
Good Dennis E
Home Financials for this Owner
Home Financials are based on the most recent Mortgage that was taken out on this home.
Original Mortgage
$188,516
Interest Rate
4.25%
Mortgage Type
FHA
Purchase Details
Closed on
Aug 5, 2009
Sold by
Good Dennis E
Bought by
Good Dennis E
Home Financials for this Owner
Home Financials are based on the most recent Mortgage that was taken out on this home.
Original Mortgage
$207,264
Interest Rate
4.7%
Mortgage Type
FHA
Purchase Details
Closed on
Oct 31, 2007
Sold by
Good Dennis E
Bought by
Good Dennis E
Home Financials for this Owner
Home Financials are based on the most recent Mortgage that was taken out on this home.
Original Mortgage
$214,500
Interest Rate
5.86%
Mortgage Type
New Conventional
Purchase Details
Closed on
May 25, 2007
Sold by
Good Dennis E
Bought by
Good Dennis E
Purchase Details
Closed on
Dec 28, 2004
Sold by
Good Dennis E
Bought by
Good Dennis E
Home Financials for this Owner
Home Financials are based on the most recent Mortgage that was taken out on this home.
Original Mortgage
$180,000
Interest Rate
5.7%
Mortgage Type
Credit Line Revolving
Purchase Details
Closed on
Mar 23, 2000
Sold by
Vickie Good
Bought by
Good Dennis E
Home Financials for this Owner
Home Financials are based on the most recent Mortgage that was taken out on this home.
Original Mortgage
$177,000
Interest Rate
8%
Purchase Details
Closed on
Oct 23, 1996
Sold by
Good Dennis E
Bought by
Good Dennis E and Good Vickie
Home Financials for this Owner
Home Financials are based on the most recent Mortgage that was taken out on this home.
Original Mortgage
$128,700
Interest Rate
6.12%
Create a Home Valuation Report for This Property
The Home Valuation Report is an in-depth analysis detailing your home's value as well as a comparison with similar homes in the area
Home Values in the Area
Average Home Value in this Area
Purchase History
| Date | Buyer | Sale Price | Title Company |
|---|---|---|---|
| Good Dennis E | -- | None Available | |
| Good Dennis E | -- | None Available | |
| Good Dennis E | -- | Accommodation | |
| Good Dennis E | -- | Orange Coast Title | |
| Good Dennis E | -- | Orange Coast Title | |
| Good Dennis E | -- | Orange Coast Title | |
| Good Dennis E | -- | Orange Coast Title | |
| Good Dennis E | -- | Orange Coast Title | |
| Good Dennis E | -- | Orange Coast Title | |
| Good Dennis E | -- | Orange Coast Title | |
| Good Dennis E | -- | None Available | |
| Good Dennis E | -- | North American Title Co | |
| Good Dennis E | -- | Frontier Title Company | |
| Good Dennis E | -- | -- |
Source: Public Records
Mortgage History
| Date | Status | Borrower | Loan Amount |
|---|---|---|---|
| Closed | Good Dennis E | $158,350 | |
| Closed | Good Dennis E | $182,961 | |
| Closed | Good Dennis E | $188,516 | |
| Closed | Good Dennis E | $207,264 | |
| Closed | Good Dennis E | $214,500 | |
| Closed | Good Dennis E | $180,000 | |
| Closed | Good Dennis E | $177,000 | |
| Closed | Good Dennis E | $128,700 |
Source: Public Records
Tax History Compared to Growth
Tax History
| Year | Tax Paid | Tax Assessment Tax Assessment Total Assessment is a certain percentage of the fair market value that is determined by local assessors to be the total taxable value of land and additions on the property. | Land | Improvement |
|---|---|---|---|---|
| 2025 | $3,024 | $271,228 | $57,416 | $213,812 |
| 2024 | $3,024 | $265,911 | $56,291 | $209,620 |
| 2023 | $2,932 | $260,698 | $55,188 | $205,510 |
| 2022 | $2,896 | $255,587 | $54,106 | $201,481 |
| 2021 | $2,866 | $250,577 | $53,046 | $197,531 |
| 2020 | $2,800 | $248,009 | $52,503 | $195,506 |
| 2019 | $2,732 | $243,147 | $51,474 | $191,673 |
| 2018 | $2,816 | $238,380 | $50,465 | $187,915 |
| 2017 | $4,978 | $233,707 | $49,476 | $184,231 |
| 2016 | $2,662 | $229,125 | $48,506 | $180,619 |
| 2015 | $2,488 | $225,684 | $47,778 | $177,906 |
| 2014 | $2,465 | $221,265 | $46,843 | $174,422 |
Source: Public Records
Map
Nearby Homes
- 1039 Valley Oak Way
- 1031 Valley Oak Way
- 1032 Wood Hollow Cir
- 2825 Regatta Cir
- Arlo Plan at Villages at Fairfield - Summerwalk at the Villages
- Bennett Plan at Villages at Fairfield - Summerwalk at the Villages
- Carson Plan at Villages at Fairfield - Summerwalk at the Villages
- Darby Plan at Villages at Fairfield - Summerwalk at the Villages
- 2855 Candleberry Way
- 2350 Gull Ct
- 1336 Renewal Ln
- 1328 Horizon Cir
- 1336 Jamboree Dr
- 2856 Rebecca Dr
- 1116 Gannet Ct
- 2429 Baltic Dr
- 2386 Baltic Ct
- 1012 Tanager Ln
- 2784 Ambrosia Way
- 2928 Candleberry Way
- 2769 Woodmont Ct
- 2765 Woodmont Ct
- 2774 Peppertree Dr
- 2770 Peppertree Dr
- 2778 Peppertree Dr
- 1109 Charter Ln
- 2766 Peppertree Dr
- 1113 Charter Ln
- 1105 Charter Ln
- 1117 Charter Ln
- 2771 Woodmont Ct
- 2762 Peppertree Dr
- 1101 Charter Ln
- 2773 Woodmont Ct
- 1121 Charter Ln
- 2761 Woodmont Dr
- 2758 Peppertree Dr
- 2775 Woodmont Dr
- 2757 Woodmont Dr