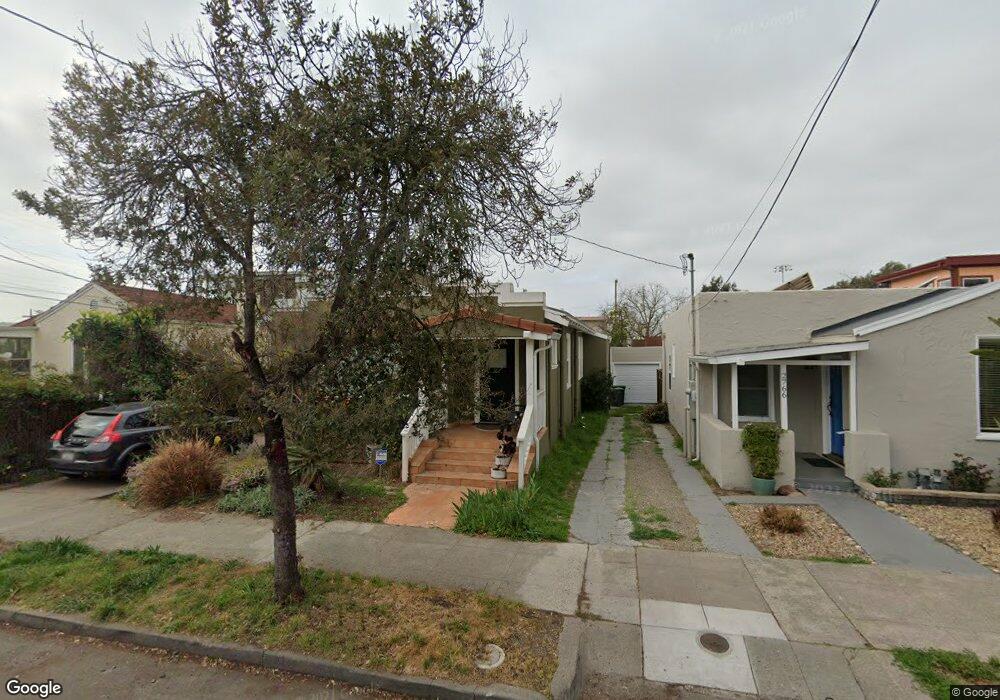
2768 Acton St Berkeley, CA 94702
West Berkeley NeighborhoodEstimated Value: $857,000 - $1,586,000
3
Beds
2
Baths
1,075
Sq Ft
$1,102/Sq Ft
Est. Value
About This Home
This home is located at 2768 Acton St, Berkeley, CA 94702 and is currently estimated at $1,184,333, approximately $1,101 per square foot. 2768 Acton St is a home located in Alameda County with nearby schools including Malcolm X Elementary School, Washington Elementary School, and Oxford Elementary School.
Ownership History
Date
Name
Owned For
Owner Type
Purchase Details
Closed on
Apr 19, 2016
Sold by
Monday Anthony Kyle and Tascian Ani S
Bought by
Monday Anthony Kyle and Tascian Ani S
Current Estimated Value
Home Financials for this Owner
Home Financials are based on the most recent Mortgage that was taken out on this home.
Original Mortgage
$497,000
Outstanding Balance
$395,483
Interest Rate
3.73%
Mortgage Type
New Conventional
Estimated Equity
$788,850
Purchase Details
Closed on
Apr 22, 2011
Sold by
Deutsche Bank National Trust Company
Bought by
Monday Anthony K and Tascian Ani S
Home Financials for this Owner
Home Financials are based on the most recent Mortgage that was taken out on this home.
Original Mortgage
$414,655
Interest Rate
4.46%
Mortgage Type
New Conventional
Purchase Details
Closed on
Sep 8, 2010
Sold by
Singh Sarabjit and Kaur Simran
Bought by
Deutsche Bank National Trust Company
Purchase Details
Closed on
Mar 8, 2006
Sold by
Murillo Victor
Bought by
Singh Sarabjit and Kaur Simran
Home Financials for this Owner
Home Financials are based on the most recent Mortgage that was taken out on this home.
Original Mortgage
$492,000
Interest Rate
7.9%
Mortgage Type
Purchase Money Mortgage
Purchase Details
Closed on
Aug 15, 2005
Sold by
Smith Freeman Leon W and Smith Thomas Genevieve
Bought by
Murillo Victor
Home Financials for this Owner
Home Financials are based on the most recent Mortgage that was taken out on this home.
Original Mortgage
$65,000
Interest Rate
5.61%
Mortgage Type
Stand Alone Second
Purchase Details
Closed on
Mar 25, 2004
Sold by
Thomas Genevieve Smith
Bought by
Smith Freeman Leon and Smith Thomas Genevieve
Create a Home Valuation Report for This Property
The Home Valuation Report is an in-depth analysis detailing your home's value as well as a comparison with similar homes in the area
Home Values in the Area
Average Home Value in this Area
Purchase History
| Date | Buyer | Sale Price | Title Company |
|---|---|---|---|
| Monday Anthony Kyle | -- | Title365 Company | |
| Monday Anthony K | $403,000 | Ptc Title | |
| Deutsche Bank National Trust Company | $487,733 | Accommodation | |
| Singh Sarabjit | $615,000 | Commonwealth Land Title Co | |
| Murillo Victor | $325,000 | Old Republic Title Company | |
| Murillo Victor | -- | Old Republic Title Company | |
| Smith Freeman Leon | -- | -- |
Source: Public Records
Mortgage History
| Date | Status | Borrower | Loan Amount |
|---|---|---|---|
| Open | Monday Anthony Kyle | $497,000 | |
| Previous Owner | Monday Anthony K | $414,655 | |
| Previous Owner | Singh Sarabjit | $492,000 | |
| Previous Owner | Murillo Victor | $65,000 | |
| Previous Owner | Murillo Victor | $260,000 |
Source: Public Records
Tax History
| Year | Tax Paid | Tax Assessment Tax Assessment Total Assessment is a certain percentage of the fair market value that is determined by local assessors to be the total taxable value of land and additions on the property. | Land | Improvement |
|---|---|---|---|---|
| 2025 | $9,348 | $545,130 | $151,849 | $393,281 |
| 2024 | $9,348 | $534,444 | $148,872 | $385,572 |
| 2023 | $9,143 | $523,967 | $145,954 | $378,013 |
| 2022 | $8,957 | $513,694 | $143,092 | $370,602 |
| 2021 | $8,935 | $503,624 | $140,287 | $363,337 |
| 2020 | $8,223 | $478,833 | $138,850 | $339,983 |
| 2019 | $7,330 | $453,761 | $136,128 | $317,633 |
| 2018 | $7,199 | $444,867 | $133,460 | $311,407 |
| 2017 | $6,930 | $436,146 | $130,844 | $305,302 |
| 2016 | $6,681 | $427,594 | $128,278 | $299,316 |
| 2015 | $6,589 | $421,174 | $126,352 | $294,822 |
| 2014 | $6,535 | $412,925 | $123,877 | $289,048 |
Source: Public Records
Map
Nearby Homes
- 2790 Sacramento St
- 2782 Sacramento St
- 2774 Sacramento St
- 2717 Mabel St
- 2758 Sacramento St
- 1450 Ward St
- 2750 Sacramento St
- 2922 Stanton St
- 1314 Ashby Ave
- 1515 Derby St
- 1237 Ashby Ave
- 1535 Julia St
- 2829 California St
- 3032 Mabel St
- 1034 Grayson St
- 1507 Prince St
- 1135 Parker St
- 1010 Grayson St
- 3101 Sacramento St
- 1612 Parker St
Your Personal Tour Guide
Ask me questions while you tour the home.