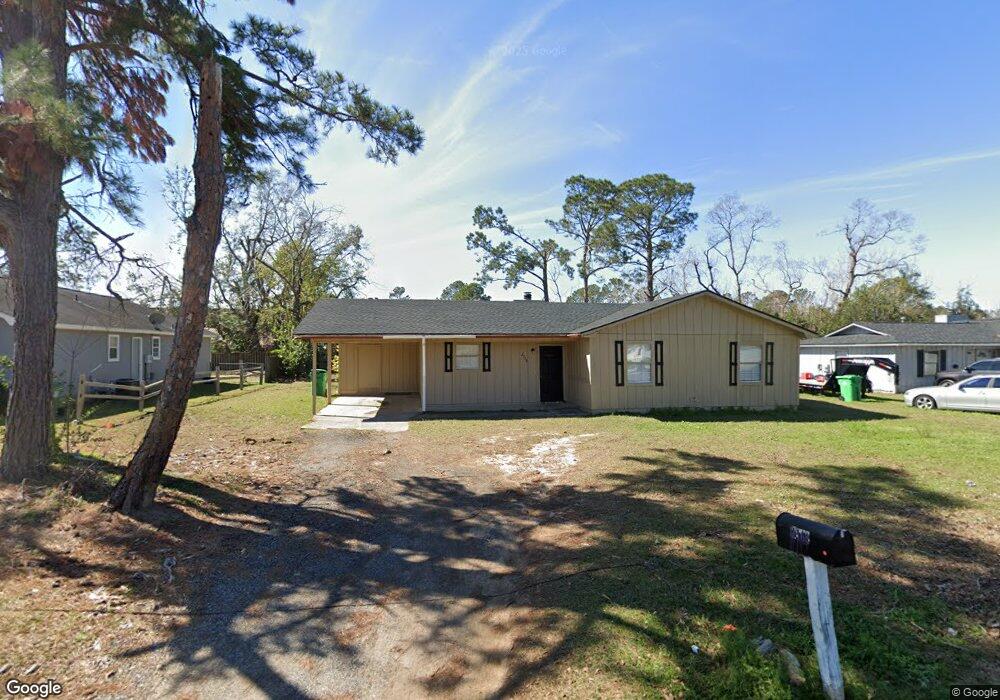
2768 Tyndall Dr Valdosta, GA 31602
Estimated Value: $132,970 - $159,000
--
Bed
2
Baths
1,166
Sq Ft
$129/Sq Ft
Est. Value
About This Home
This home is located at 2768 Tyndall Dr, Valdosta, GA 31602 and is currently estimated at $149,993, approximately $128 per square foot. 2768 Tyndall Dr is a home located in Lowndes County with nearby schools including W.G. Nunn Elementary School, Newbern Middle School, and Valdosta High School.
Ownership History
Date
Name
Owned For
Owner Type
Purchase Details
Closed on
Jan 31, 2019
Sold by
Mjs Utility & Investments Llc
Bought by
Houser Investment Properties Llc
Current Estimated Value
Purchase Details
Closed on
Jun 3, 2009
Sold by
Houser Investment Properties Llc
Bought by
Mjs Utility & Investments Llc
Home Financials for this Owner
Home Financials are based on the most recent Mortgage that was taken out on this home.
Original Mortgage
$240,096
Interest Rate
4.77%
Mortgage Type
Purchase Money Mortgage
Purchase Details
Closed on
Jun 7, 2002
Sold by
Mcmullen Robert M
Bought by
Houser Investment Properties Llc
Purchase Details
Closed on
Mar 30, 1996
Bought by
Mcmullen Robert M
Purchase Details
Closed on
Dec 17, 1981
Bought by
Loeb Monte J and Loeb Eleanor
Purchase Details
Closed on
Jan 28, 1981
Bought by
Bufford Ruben E and Bufford Mary
Purchase Details
Closed on
Nov 19, 1980
Bought by
Rowan Homes Inc
Create a Home Valuation Report for This Property
The Home Valuation Report is an in-depth analysis detailing your home's value as well as a comparison with similar homes in the area
Home Values in the Area
Average Home Value in this Area
Purchase History
| Date | Buyer | Sale Price | Title Company |
|---|---|---|---|
| Houser Investment Properties Llc | -- | -- | |
| Mjs Utility & Investments Llc | -- | -- | |
| Houser Investment Properties Llc | $41,000 | -- | |
| Mcmullen Robert M | $48,600 | -- | |
| Loeb Monte J | $8,000 | -- | |
| Bufford Ruben E | $45,800 | -- | |
| Rowan Homes Inc | $7,800 | -- |
Source: Public Records
Mortgage History
| Date | Status | Borrower | Loan Amount |
|---|---|---|---|
| Previous Owner | Mjs Utility & Investments Llc | $240,096 |
Source: Public Records
Tax History Compared to Growth
Tax History
| Year | Tax Paid | Tax Assessment Tax Assessment Total Assessment is a certain percentage of the fair market value that is determined by local assessors to be the total taxable value of land and additions on the property. | Land | Improvement |
|---|---|---|---|---|
| 2024 | $885 | $31,695 | $4,800 | $26,895 |
| 2023 | $885 | $31,695 | $4,800 | $26,895 |
| 2022 | $800 | $23,658 | $4,800 | $18,858 |
| 2021 | $823 | $23,658 | $4,800 | $18,858 |
| 2020 | $840 | $23,658 | $4,800 | $18,858 |
| 2019 | $840 | $23,658 | $4,800 | $18,858 |
| 2018 | $647 | $18,000 | $4,800 | $13,200 |
| 2017 | $652 | $18,000 | $4,800 | $13,200 |
| 2016 | $651 | $18,000 | $4,800 | $13,200 |
| 2015 | $654 | $19,720 | $4,800 | $14,920 |
| 2014 | $778 | $33,314 | $12,000 | $21,314 |
Source: Public Records
Map
Nearby Homes
- 11 Crestwood Cir
- 7.63 AC Tyndall Dr
- 2019 Fallingleaf Ln
- 2835 Kirkwood Cir
- 1703 Largo Cir
- 1647 Fresno St
- 1 Pomona Cir
- 2517 Deborah Dr
- TBD Jaycee Shack Rd
- 3122 Tyndall Dr
- 2745 Pineview Dr
- 3200 Tyndall Dr Unit A/B
- 3202 Tyndall Dr Unit A/B
- 2713 Pineview Dr Unit A&B
- 3016 Ginny Dr
- 1724 Eli Place
- 2414 Deborah Dr
- 2821 Clayton Dr
- 1852 Chestnut Dr
- 1739 Eli Place
- 2766 Tyndall Dr
- 2800 Tyndall Dr
- 2764 Tyndall Dr
- 2713 Sheridan Place
- 2715 Sheridan Place
- 2711 Sheridan Place
- 2717 Sheridan Place
- 2709 Sheridan Place
- 2719 Sheridan Place
- 2707 Sheridan Place
- 2721 Sheridan Place
- 2705 Sheridan Place
- 2762 Tyndall Dr
- 2723 Sheridan Place
- 2802 Tyndall Dr
- 2820 Caldwell Dr
- 2725 Sheridan Place
- 2773 Tyndall Dr
- 2703 Sheridan Place
- 2760 Tyndall Dr