2768 West Fork Pine Creek Rd Pinehurst, ID 83850
Estimated Value: $678,000 - $840,374
5
Beds
3
Baths
3,354
Sq Ft
$226/Sq Ft
Est. Value
About This Home
This home is located at 2768 West Fork Pine Creek Rd, Pinehurst, ID 83850 and is currently estimated at $759,187, approximately $226 per square foot. 2768 West Fork Pine Creek Rd is a home located in Shoshone County with nearby schools including Pinehurst Elementary School, Kellogg Middle School, and Kellogg High School.
Ownership History
Date
Name
Owned For
Owner Type
Purchase Details
Closed on
Dec 20, 2019
Sold by
Krusemark Ronald Lee
Bought by
Madill Caroline J
Current Estimated Value
Home Financials for this Owner
Home Financials are based on the most recent Mortgage that was taken out on this home.
Original Mortgage
$96,900
Outstanding Balance
$85,431
Interest Rate
3.6%
Mortgage Type
New Conventional
Estimated Equity
$673,756
Purchase Details
Closed on
Apr 14, 2011
Sold by
Riggs Hilary
Bought by
Krusemark Ronald Lee
Home Financials for this Owner
Home Financials are based on the most recent Mortgage that was taken out on this home.
Original Mortgage
$150,400
Interest Rate
4.83%
Mortgage Type
New Conventional
Purchase Details
Closed on
Mar 23, 2007
Sold by
Kiebert Connie
Bought by
Kiebert Jerome
Home Financials for this Owner
Home Financials are based on the most recent Mortgage that was taken out on this home.
Original Mortgage
$150,000
Interest Rate
6.29%
Mortgage Type
New Conventional
Create a Home Valuation Report for This Property
The Home Valuation Report is an in-depth analysis detailing your home's value as well as a comparison with similar homes in the area
Home Values in the Area
Average Home Value in this Area
Purchase History
| Date | Buyer | Sale Price | Title Company |
|---|---|---|---|
| Madill Caroline J | -- | Alliance Title Coeur D Alen | |
| Krusemark Ronald Lee | -- | -- | |
| Kiebert Jerome | -- | -- |
Source: Public Records
Mortgage History
| Date | Status | Borrower | Loan Amount |
|---|---|---|---|
| Open | Madill Caroline J | $96,900 | |
| Previous Owner | Krusemark Ronald Lee | $150,400 | |
| Previous Owner | Kiebert Jerome | $150,000 |
Source: Public Records
Tax History Compared to Growth
Tax History
| Year | Tax Paid | Tax Assessment Tax Assessment Total Assessment is a certain percentage of the fair market value that is determined by local assessors to be the total taxable value of land and additions on the property. | Land | Improvement |
|---|---|---|---|---|
| 2025 | $3,731 | $698,361 | $148,990 | $549,371 |
| 2024 | $3,731 | $698,361 | $148,990 | $549,371 |
| 2023 | $3,731 | $702,441 | $148,990 | $553,451 |
| 2022 | $3,614 | $540,309 | $57,330 | $482,979 |
| 2021 | $3,324 | $389,933 | $39,047 | $350,886 |
| 2020 | $1,816 | $221,597 | $3,268 | $218,329 |
| 2019 | $1,663 | $215,760 | $3,112 | $212,648 |
| 2018 | $1,452 | $171,363 | $2,964 | $168,399 |
| 2017 | $1,278 | $152,934 | $2,850 | $150,084 |
| 2016 | $1,318 | $151,641 | $2,736 | $148,905 |
| 2015 | -- | $164,291 | $2,736 | $161,555 |
| 2014 | -- | $241,830 | $26,125 | $215,705 |
Source: Public Records
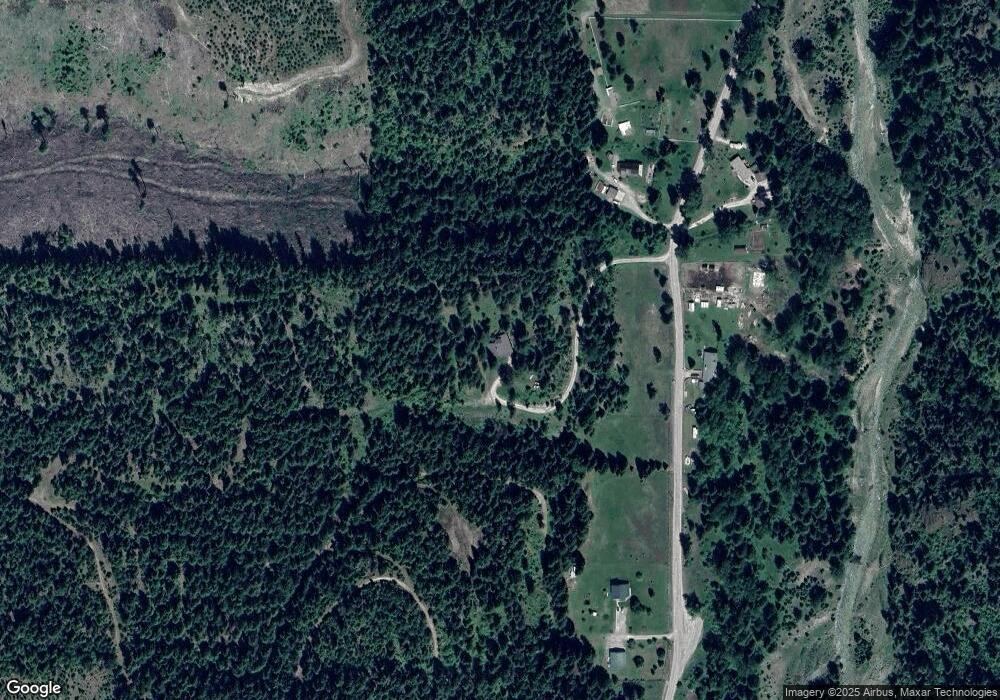
Map
Nearby Homes
- 146 Barker Loop
- 164 W Fork Pine Creek Rd
- 441 Moose Mountain Ln
- Lot 3 Moose Mountain Ln
- 625 E Fork French Gulch Rd
- 0 Nka East Fork French Gulch
- 30.91acs French Gulch Rd
- 3 Elsie Peak Ct Unit 3
- 99 Lookout Peak Dr
- 1 Elsie Peak Ct Unit B1, BLDG B
- 508 B St
- 102 Pine Ave
- 106 Blazing Saddle
- 307 Woodland Dr
- 754 Paradise Ln
- 301 Woodland Dr
- 305 1st
- NKA Kellogg Parcel 2
- NKA Appleberg Rd
- 505 Wyoming St
- 2768 West Fork Pine Creek Rd
- 2768 W Fork Pine Creek Rd
- 2827 West Fork Pine Creek Rd
- 2827 West Fork Pine Creek Rd
- 2827 W Fork Pine Creek Rd
- 2752 West Fork Pine Creek Rd
- 2752 W Fork Pine Creek Rd
- 2952 West Fork Pine Creek Rd
- 2952 W Fork Pine Creek Rd
- NKA Fork Pine Creek
- 2450 West Fork Pine Creek Rd
- 2450 W Fork Pine Creek Rd
- 679 W Fork Pine Creek Rd
- 0 W Fork Pine Creek Rd
- NNA W Fork Pine Creek Rd