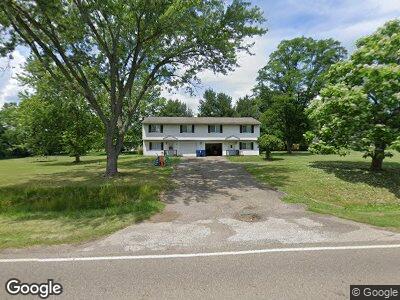
2769 Vanderhoof Rd Unit 2773 Barberton, OH 44203
Estimated Value: $234,000 - $263,812
4
Beds
4
Baths
2,580
Sq Ft
$98/Sq Ft
Est. Value
About This Home
This home is located at 2769 Vanderhoof Rd Unit 2773, Barberton, OH 44203 and is currently estimated at $252,703, approximately $97 per square foot. 2769 Vanderhoof Rd Unit 2773 is a home located in Summit County with nearby schools including Norton Primary Elementary School, Norton Middle School, and Norton High School.
Ownership History
Date
Name
Owned For
Owner Type
Purchase Details
Closed on
Mar 22, 2021
Sold by
Starcher Jason E
Bought by
Abbas Ala Rebhi and Salameh Ahlam Ibrahim
Current Estimated Value
Home Financials for this Owner
Home Financials are based on the most recent Mortgage that was taken out on this home.
Original Mortgage
$142,500
Outstanding Balance
$129,529
Interest Rate
2.73%
Mortgage Type
Commercial
Estimated Equity
$125,038
Purchase Details
Closed on
Oct 18, 2002
Sold by
Gardner Heather and Gardner Jason E
Bought by
Starcher Jason E
Purchase Details
Closed on
Mar 12, 2001
Sold by
Mognet Margaret G and Mognet Stephanie D
Bought by
Starcher Jason E and Gardner Heather A
Home Financials for this Owner
Home Financials are based on the most recent Mortgage that was taken out on this home.
Original Mortgage
$134,910
Interest Rate
7.13%
Mortgage Type
Purchase Money Mortgage
Create a Home Valuation Report for This Property
The Home Valuation Report is an in-depth analysis detailing your home's value as well as a comparison with similar homes in the area
Home Values in the Area
Average Home Value in this Area
Purchase History
| Date | Buyer | Sale Price | Title Company |
|---|---|---|---|
| Abbas Ala Rebhi | $190,000 | America Land Title Llc | |
| Starcher Jason E | $149,900 | Falls Title Agency Inc |
Source: Public Records
Mortgage History
| Date | Status | Borrower | Loan Amount |
|---|---|---|---|
| Open | Abbas Ala Rebhi | $142,500 | |
| Previous Owner | Starcher Jason E | $96,400 | |
| Previous Owner | Starcher Jason E | $134,000 | |
| Previous Owner | Starcher Jason E | $134,000 | |
| Previous Owner | Starcher Jason E | $5,000 | |
| Previous Owner | Starcher Jason E | $134,910 |
Source: Public Records
Tax History Compared to Growth
Tax History
| Year | Tax Paid | Tax Assessment Tax Assessment Total Assessment is a certain percentage of the fair market value that is determined by local assessors to be the total taxable value of land and additions on the property. | Land | Improvement |
|---|---|---|---|---|
| 2025 | $2,737 | $65,482 | $17,115 | $48,367 |
| 2024 | $2,737 | $65,482 | $17,115 | $48,367 |
| 2023 | $2,737 | $65,482 | $17,115 | $48,367 |
| 2022 | $2,396 | $46,260 | $12,054 | $34,206 |
| 2021 | $2,405 | $46,260 | $12,054 | $34,206 |
| 2020 | $2,360 | $46,260 | $12,050 | $34,210 |
| 2019 | $3,021 | $54,020 | $16,910 | $37,110 |
| 2018 | $2,974 | $54,020 | $16,910 | $37,110 |
| 2017 | $3,006 | $54,020 | $16,910 | $37,110 |
| 2016 | $2,968 | $49,090 | $16,910 | $32,180 |
| 2015 | $3,006 | $49,090 | $16,910 | $32,180 |
| 2014 | $2,980 | $49,090 | $16,910 | $32,180 |
| 2013 | $3,104 | $51,780 | $16,910 | $34,870 |
Source: Public Records
Map
Nearby Homes
- 2707 Himelrigh Blvd
- V/L Monroe Square
- 2580 Emmons Dr
- 5206 Frederick St
- V/L Bishop Oval
- 3114 Vanderhoof Rd
- V/L 3 Grill Rd
- V/L 2 Grill Rd
- V/L 1 Grill Rd
- 5675 Overture Way
- 2931 Union St
- 5791 Lyric Dr
- 540 31st St SW
- 3336 Lullaby Ln
- 515 S Van Buren Ave
- 0 Taylor Rd Unit 5107450
- 242 28th St SW
- 000 Haynes Ave
- 1592 Wilsonway Dr
- 1352 Benton St
- 2769 Vanderhoof Rd Unit 2773
- 2640 Rennie Ct
- 2773 Vanderhoof Rd
- 2793 Vanderhoof Rd Unit 2797
- 2751 Vanderhoof Rd Unit 2755
- 2797 Vanderhoof Rd
- 2764 Vanderhoof Rd
- 5460 Ethics Ct Unit 5462
- 5462 Ethics Ct
- 2650 Rennie Ct
- 2776 Vanderhoof Rd
- 2637 Rennie Ct
- 2635 Rennie Ct Unit 2637
- 5450 Ethics Ct Unit 5454
- 2643 Rennie Ct
- 2806 Vanderhoof Rd
- 2746 Vanderhoof Rd
- 2819 Vanderhoof Rd Unit 2823
- 5440 Ethics Ct Unit 5444
- 2816 Vanderhoof Rd