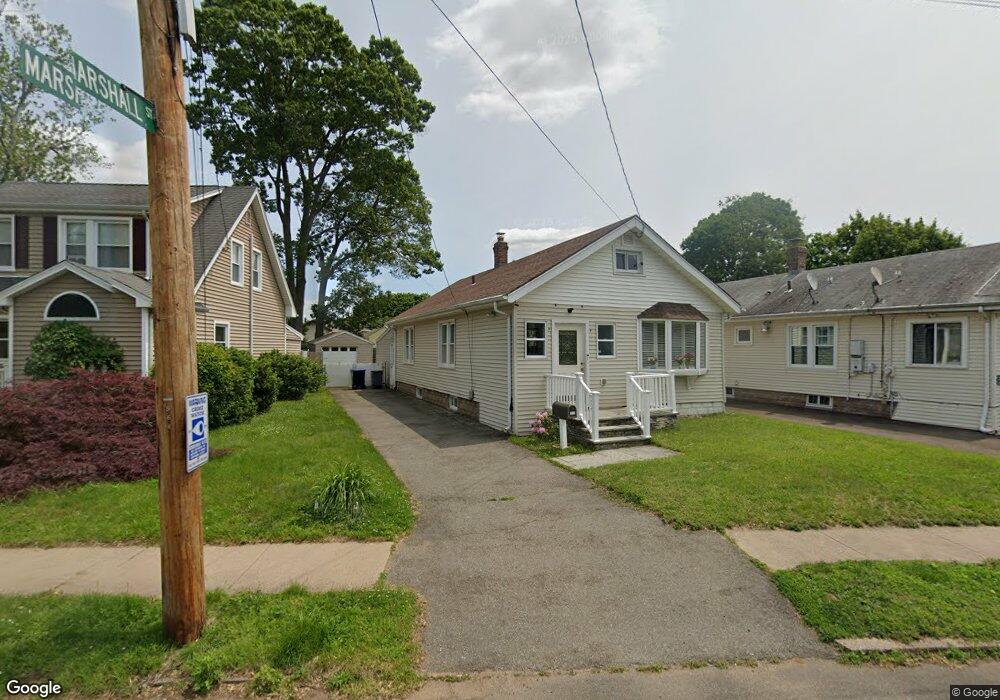
277 3rd Ave West Haven, CT 06516
West Haven Center NeighborhoodEstimated Value: $305,492 - $336,000
2
Beds
1
Bath
1,064
Sq Ft
$304/Sq Ft
Est. Value
About This Home
This home is located at 277 3rd Ave, West Haven, CT 06516 and is currently estimated at $323,623, approximately $304 per square foot. 277 3rd Ave is a home located in New Haven County with nearby schools including Carrigan 5/6 Intermediate School, Harry M. Bailey Middle School, and West Haven High School.
Ownership History
Date
Name
Owned For
Owner Type
Purchase Details
Closed on
Aug 9, 2024
Sold by
Chuckrey Ann M
Bought by
House Robert V
Current Estimated Value
Purchase Details
Closed on
Apr 29, 2021
Sold by
Brown Jessica
Bought by
Brown Bryan
Home Financials for this Owner
Home Financials are based on the most recent Mortgage that was taken out on this home.
Original Mortgage
$155,000
Interest Rate
3.1%
Mortgage Type
Balloon
Create a Home Valuation Report for This Property
The Home Valuation Report is an in-depth analysis detailing your home's value as well as a comparison with similar homes in the area
Home Values in the Area
Average Home Value in this Area
Purchase History
| Date | Buyer | Sale Price | Title Company |
|---|---|---|---|
| House Robert V | -- | None Available | |
| House Robert V | -- | None Available | |
| Brown Bryan | -- | None Available | |
| Brown Bryan | -- | None Available |
Source: Public Records
Mortgage History
| Date | Status | Borrower | Loan Amount |
|---|---|---|---|
| Previous Owner | Brown Bryan | $155,000 |
Source: Public Records
Tax History
| Year | Tax Paid | Tax Assessment Tax Assessment Total Assessment is a certain percentage of the fair market value that is determined by local assessors to be the total taxable value of land and additions on the property. | Land | Improvement |
|---|---|---|---|---|
| 2025 | $6,239 | $180,670 | $58,940 | $121,730 |
| 2024 | $5,326 | $109,760 | $40,810 | $68,950 |
| 2023 | $5,105 | $109,760 | $40,810 | $68,950 |
| 2022 | $5,005 | $109,760 | $40,810 | $68,950 |
| 2021 | $5,005 | $109,760 | $40,810 | $68,950 |
| 2020 | $4,723 | $93,590 | $32,830 | $60,760 |
| 2019 | $4,555 | $93,590 | $32,830 | $60,760 |
| 2018 | $4,516 | $93,590 | $32,830 | $60,760 |
| 2017 | $4,273 | $93,590 | $32,830 | $60,760 |
| 2016 | $4,264 | $93,590 | $32,830 | $60,760 |
| 2015 | $4,160 | $103,110 | $36,610 | $66,500 |
| 2014 | $4,135 | $103,110 | $36,610 | $66,500 |
Source: Public Records
Map
Nearby Homes
Your Personal Tour Guide
Ask me questions while you tour the home.