Estimated Value: $312,861 - $361,000
3
Beds
2
Baths
1,100
Sq Ft
$308/Sq Ft
Est. Value
About This Home
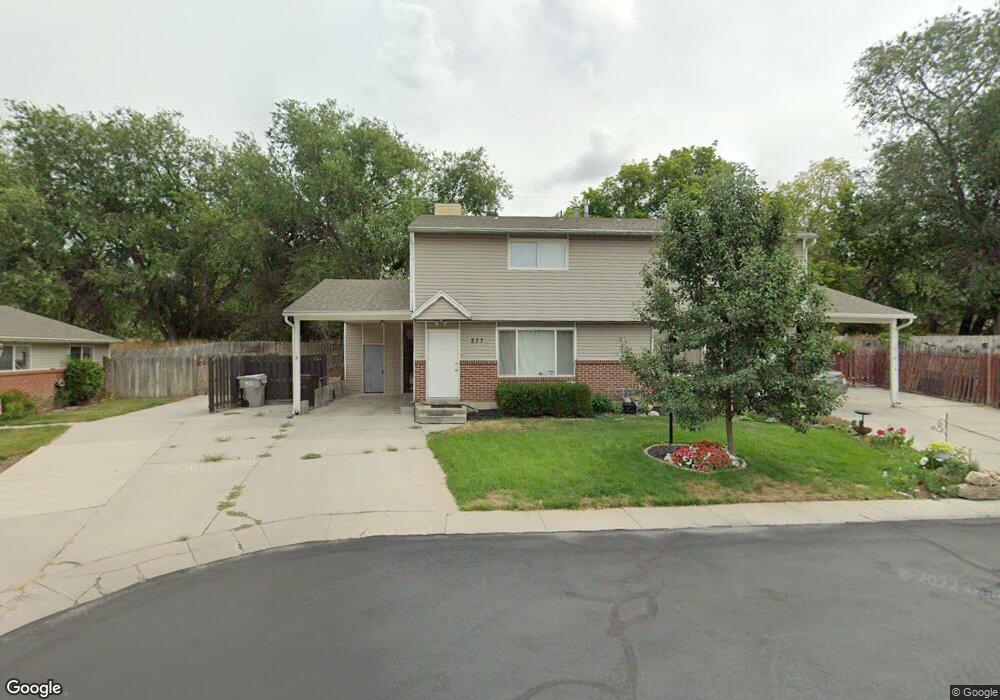
This home is located at 277 E 8355 S, Sandy, UT 84070 and is currently estimated at $338,715, approximately $307 per square foot. 277 E 8355 S is a home located in Salt Lake County with nearby schools including Midvalley Elementary School, Union Middle School, and Hillcrest High School.
Ownership History
Date
Name
Owned For
Owner Type
Purchase Details
Closed on
Jan 23, 2007
Sold by
Baquerizo Alexandra I
Bought by
Brandon Jamie
Current Estimated Value
Home Financials for this Owner
Home Financials are based on the most recent Mortgage that was taken out on this home.
Original Mortgage
$142,000
Outstanding Balance
$84,338
Interest Rate
6.1%
Mortgage Type
Purchase Money Mortgage
Estimated Equity
$254,377
Purchase Details
Closed on
Jun 7, 2004
Sold by
Hendricks Michael M and Hendricks Christine F
Bought by
Baquerizo Alexandra I
Home Financials for this Owner
Home Financials are based on the most recent Mortgage that was taken out on this home.
Original Mortgage
$92,150
Interest Rate
6.55%
Mortgage Type
Purchase Money Mortgage
Purchase Details
Closed on
Mar 30, 2004
Sold by
Hendricks Christine F and Hendricks Riley S
Bought by
Hendricks Michael M and Hendricks Christine F
Purchase Details
Closed on
May 26, 1999
Sold by
Frampton Paul
Bought by
Hendricks Christen F and Hendricks Riley S
Create a Home Valuation Report for This Property
The Home Valuation Report is an in-depth analysis detailing your home's value as well as a comparison with similar homes in the area
Home Values in the Area
Average Home Value in this Area
Purchase History
| Date | Buyer | Sale Price | Title Company |
|---|---|---|---|
| Brandon Jamie | -- | Premier Title Ins Agency | |
| Baquerizo Alexandra I | -- | Sutherland Title | |
| Hendricks Michael M | -- | Sutherland Title | |
| Hendricks Christen F | -- | Merrill Title |
Source: Public Records
Mortgage History
| Date | Status | Borrower | Loan Amount |
|---|---|---|---|
| Open | Brandon Jamie | $142,000 | |
| Previous Owner | Baquerizo Alexandra I | $92,150 |
Source: Public Records
Tax History
| Year | Tax Paid | Tax Assessment Tax Assessment Total Assessment is a certain percentage of the fair market value that is determined by local assessors to be the total taxable value of land and additions on the property. | Land | Improvement |
|---|---|---|---|---|
| 2025 | $1,583 | $276,400 | $82,900 | $193,500 |
| 2024 | $1,583 | $292,400 | $87,700 | $204,700 |
| 2023 | $1,656 | $305,000 | $91,500 | $213,500 |
| 2022 | $1,738 | $313,000 | $93,900 | $219,100 |
| 2021 | $1,560 | $238,800 | $71,600 | $167,200 |
| 2020 | $1,309 | $189,000 | $56,700 | $132,300 |
| 2019 | $1,257 | $176,800 | $53,000 | $123,800 |
| 2016 | $1,103 | $125,400 | $37,600 | $87,800 |
Source: Public Records
Map
Nearby Homes
- 359 E 8400 S
- 8459 S 300 E
- 227 E St Germain Way
- 144 E Chambord Ct
- 140 E Chambord Ct
- 138 E Chambord Ct
- 136 E Chambord Ct
- 132 E Chambord Ct
- 8278 S Resaca Dr Unit L1
- 194 Pioneer Ave
- 220 E Pioneer Ave
- 8264 S Resaca Dr Unit K9
- 149 E Pioneer Ave
- 117 E Calbourne Ln Unit I4
- 274 E Water Mill Way Unit 230
- 116 E Resaca Dr Unit F2
- 257 Water Mill Way Unit 211
- 257 E Water Mill Way
- 8322 S Levine Ln Unit 111
- 8470 Solar Way
- 274 E 8355 S Unit 15B
- 269 E 8355 S
- 267 E 8375 S Unit 14A
- 271 E 8375 S
- 259 E 8355 S
- 261 E 8375 S
- 261 E 8375 S Unit 13B
- 8368 S 300 E
- 258 E 8355 S
- 8321 Julie Anna Ct Unit 8323
- 8321 S Julie Anna Ct
- 255 E 8355 S Unit 17B
- 251 E 8355 S
- 266 E 8375 S
- 8320 S Julie Anna Ct
- 8320 Julie Anna Ct Unit 8322
- 262 E 8375 S
- 250 E 8375 S
- 252 E 8375 S
- 250 E 8355 S
Your Personal Tour Guide
Ask me questions while you tour the home.