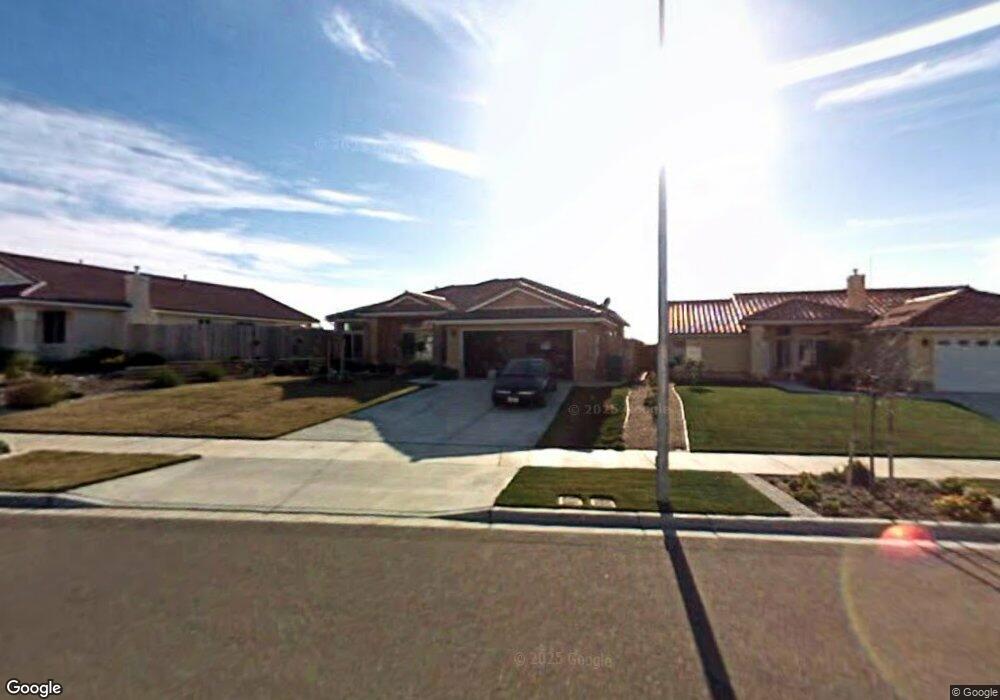
277 Nandina Ln Nipomo, CA 93444
Estimated Value: $774,000 - $853,000
4
Beds
2
Baths
1,925
Sq Ft
$416/Sq Ft
Est. Value
About This Home
This home is located at 277 Nandina Ln, Nipomo, CA 93444 and is currently estimated at $801,645, approximately $416 per square foot. 277 Nandina Ln is a home located in San Luis Obispo County with nearby schools including Nipomo Elementary School, Mesa Middle School, and Nipomo High School.
Ownership History
Date
Name
Owned For
Owner Type
Purchase Details
Closed on
Dec 5, 2024
Sold by
Shaver Justin
Bought by
Shaver Sarah E
Current Estimated Value
Purchase Details
Closed on
Jul 13, 2011
Sold by
Devinney Bryan and Devinney Ira
Bought by
Shaver Justin and Shaver Sarah
Home Financials for this Owner
Home Financials are based on the most recent Mortgage that was taken out on this home.
Original Mortgage
$322,609
Interest Rate
4.37%
Mortgage Type
FHA
Purchase Details
Closed on
Feb 10, 2006
Sold by
Carriage Homes
Bought by
Devinney Bryan and Devinney Ira
Home Financials for this Owner
Home Financials are based on the most recent Mortgage that was taken out on this home.
Original Mortgage
$460,000
Interest Rate
6.5%
Mortgage Type
Fannie Mae Freddie Mac
Create a Home Valuation Report for This Property
The Home Valuation Report is an in-depth analysis detailing your home's value as well as a comparison with similar homes in the area
Home Values in the Area
Average Home Value in this Area
Purchase History
| Date | Buyer | Sale Price | Title Company |
|---|---|---|---|
| Shaver Sarah E | -- | None Listed On Document | |
| Shaver Sarah E | -- | None Listed On Document | |
| Shaver Justin | $331,000 | Fidelity National Title Co | |
| Devinney Bryan | $575,000 | First American Title Co |
Source: Public Records
Mortgage History
| Date | Status | Borrower | Loan Amount |
|---|---|---|---|
| Previous Owner | Shaver Justin | $322,609 | |
| Previous Owner | Devinney Bryan | $460,000 |
Source: Public Records
Tax History Compared to Growth
Tax History
| Year | Tax Paid | Tax Assessment Tax Assessment Total Assessment is a certain percentage of the fair market value that is determined by local assessors to be the total taxable value of land and additions on the property. | Land | Improvement |
|---|---|---|---|---|
| 2025 | $4,346 | $415,741 | $188,401 | $227,340 |
| 2024 | $4,295 | $407,590 | $184,707 | $222,883 |
| 2023 | $4,295 | $399,599 | $181,086 | $218,513 |
| 2022 | $4,230 | $391,765 | $177,536 | $214,229 |
| 2021 | $4,220 | $384,084 | $174,055 | $210,029 |
| 2020 | $4,171 | $380,147 | $172,271 | $207,876 |
| 2019 | $4,145 | $372,694 | $168,894 | $203,800 |
| 2018 | $4,095 | $365,387 | $165,583 | $199,804 |
| 2017 | $4,018 | $358,224 | $162,337 | $195,887 |
| 2016 | $3,791 | $351,201 | $159,154 | $192,047 |
| 2015 | $3,736 | $345,927 | $156,764 | $189,163 |
| 2014 | $3,599 | $339,152 | $153,694 | $185,458 |
Source: Public Records
Map
Nearby Homes
- 150 E Chestnut St
- 189 E Tefft St
- 285 E Tefft St
- 1 W Branch St
- 412 N Mallagh St
- 0 S Burton St
- 400 N Oakglen Ave
- 90111003 W Price St
- 160 San Antonio Ln
- 449 W Tefft St Unit 23
- 449 W Tefft St Unit 13
- 230 Hans Place
- 525 Grande Ave Unit D
- 255 Encino Ln
- 368 Avenida de Amigos
- 228 Chaparral Ln
- 680 Hill St
- 450 Avenida de Socios Unit 12
- Mesa Plan at Hill Street Terraces - Hill Street Series
- Pacific Plan at Hill Street Terraces - Hill Street Series