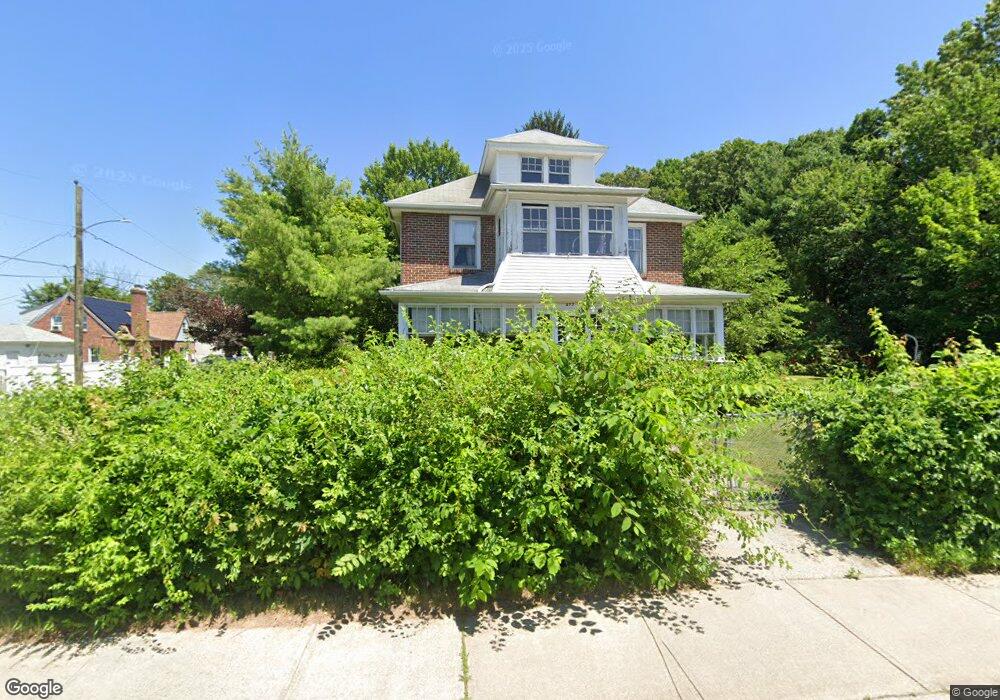
277 Oak St Indian Orchard, MA 01151
Indian Orchard NeighborhoodEstimated Value: $263,000 - $320,778
4
Beds
2
Baths
1,904
Sq Ft
$153/Sq Ft
Est. Value
About This Home
This home is located at 277 Oak St, Indian Orchard, MA 01151 and is currently estimated at $291,945, approximately $153 per square foot. 277 Oak St is a home located in Hampden County with nearby schools including Indian Orchard Elementary School, John F. Kennedy Academy, and Roger L. Putnam Vocational Technical Academy.
Ownership History
Date
Name
Owned For
Owner Type
Purchase Details
Closed on
Oct 11, 2024
Sold by
Gagne Eleanor M F Est and Charron
Bought by
Charron Ft and Bevilacque
Current Estimated Value
Purchase Details
Closed on
Jun 5, 2015
Sold by
Charron Robert R and Gagne Eleanor M
Bought by
Charron Robert R and Gagne Eleanor M
Purchase Details
Closed on
Oct 27, 2008
Sold by
Charron Robert R and F-Gagne Eleanor M
Bought by
Charron Robert R and Gagne Eleanor Mf
Purchase Details
Closed on
Sep 30, 1991
Sold by
Gagne Eleanor M
Bought by
Charron Robert R
Home Financials for this Owner
Home Financials are based on the most recent Mortgage that was taken out on this home.
Original Mortgage
$76,000
Interest Rate
9.1%
Mortgage Type
Purchase Money Mortgage
Create a Home Valuation Report for This Property
The Home Valuation Report is an in-depth analysis detailing your home's value as well as a comparison with similar homes in the area
Home Values in the Area
Average Home Value in this Area
Purchase History
| Date | Buyer | Sale Price | Title Company |
|---|---|---|---|
| Charron Ft | -- | None Available | |
| Charron Ft | -- | None Available | |
| Charron Robert R | -- | -- | |
| Charron Robert R | -- | -- | |
| Charron Robert R | $50,000 | -- | |
| Charron Robert R | -- | -- | |
| Charron Robert R | -- | -- | |
| Charron Robert R | $50,000 | -- |
Source: Public Records
Mortgage History
| Date | Status | Borrower | Loan Amount |
|---|---|---|---|
| Previous Owner | Charron Robert R | $72,000 | |
| Previous Owner | Charron Robert R | $76,000 |
Source: Public Records
Tax History Compared to Growth
Tax History
| Year | Tax Paid | Tax Assessment Tax Assessment Total Assessment is a certain percentage of the fair market value that is determined by local assessors to be the total taxable value of land and additions on the property. | Land | Improvement |
|---|---|---|---|---|
| 2025 | $4,014 | $256,000 | $47,100 | $208,900 |
| 2024 | $3,745 | $233,200 | $44,000 | $189,200 |
| 2023 | $3,662 | $214,800 | $36,100 | $178,700 |
| 2022 | $3,455 | $183,600 | $33,700 | $149,900 |
| 2021 | $3,285 | $173,800 | $30,700 | $143,100 |
| 2020 | $3,144 | $161,000 | $30,700 | $130,300 |
| 2019 | $3,011 | $153,000 | $31,700 | $121,300 |
| 2018 | $2,873 | $146,000 | $31,700 | $114,300 |
| 2017 | $2,764 | $140,600 | $27,000 | $113,600 |
| 2016 | $2,662 | $135,400 | $27,000 | $108,400 |
| 2015 | -- | $134,200 | $27,000 | $107,200 |
Source: Public Records
Map
Nearby Homes