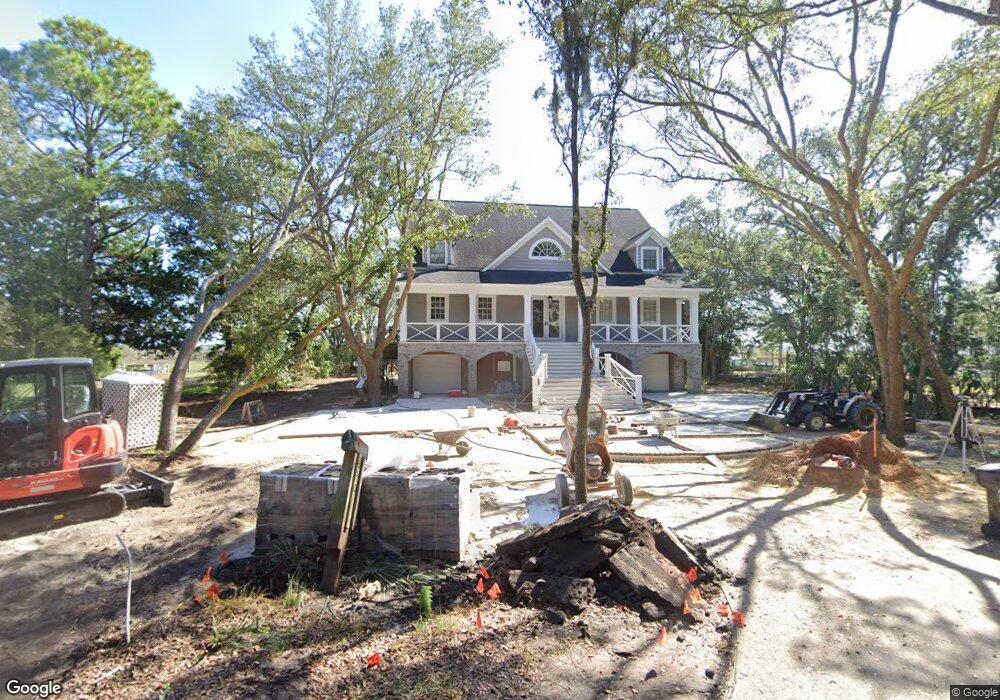
2770 Luvan Blvd Georgetown, SC 29440
Estimated Value: $2,802,000 - $3,639,000
5
Beds
5
Baths
3,737
Sq Ft
$853/Sq Ft
Est. Value
About This Home
This home is located at 2770 Luvan Blvd, Georgetown, SC 29440 and is currently estimated at $3,186,429, approximately $852 per square foot. 2770 Luvan Blvd is a home located in Georgetown County with nearby schools including Waccamaw Elementary School, Waccamaw Intermediate School, and Waccamaw Middle School.
Ownership History
Date
Name
Owned For
Owner Type
Purchase Details
Closed on
Jul 17, 2023
Sold by
Saslow John B and Saslow Virginia B
Bought by
Debordien Colony Community Association Inc
Current Estimated Value
Purchase Details
Closed on
Jul 5, 2023
Sold by
Debidue Creek Llc
Bought by
Saslow John B and Saslow Virginia B
Purchase Details
Closed on
Oct 18, 2021
Sold by
Robinson Andrea Faye
Bought by
Saslow John B and Saslow Virginia B
Home Financials for this Owner
Home Financials are based on the most recent Mortgage that was taken out on this home.
Original Mortgage
$548,250
Interest Rate
2.8%
Mortgage Type
New Conventional
Purchase Details
Closed on
Mar 29, 2021
Sold by
Robinson Andrea Faye and Estate Of Faye Harrelson Halfo
Bought by
Robinson Andrea Faye
Create a Home Valuation Report for This Property
The Home Valuation Report is an in-depth analysis detailing your home's value as well as a comparison with similar homes in the area
Home Values in the Area
Average Home Value in this Area
Purchase History
| Date | Buyer | Sale Price | Title Company |
|---|---|---|---|
| Debordien Colony Community Association Inc | -- | None Listed On Document | |
| Debordien Colony Community Association Inc | -- | None Listed On Document | |
| Debordien Colony Community Association Inc | -- | None Listed On Document | |
| Debordien Colony Community Association Inc | -- | None Listed On Document | |
| Saslow John B | -- | None Listed On Document | |
| Saslow John B | -- | None Listed On Document | |
| Saslow John B | $2,475,000 | None Available | |
| Saslow John B | $2,475,000 | None Available | |
| Robinson Andrea Faye | -- | None Available | |
| Robinson Andrea Faye | -- | None Available |
Source: Public Records
Mortgage History
| Date | Status | Borrower | Loan Amount |
|---|---|---|---|
| Previous Owner | Saslow John B | $548,250 |
Source: Public Records
Tax History
| Year | Tax Paid | Tax Assessment Tax Assessment Total Assessment is a certain percentage of the fair market value that is determined by local assessors to be the total taxable value of land and additions on the property. | Land | Improvement |
|---|---|---|---|---|
| 2025 | $35,799 | $152,642 | $61,332 | $91,310 |
| 2024 | $35,799 | $132,730 | $69,000 | $63,730 |
| 2023 | $32,588 | $132,730 | $69,000 | $63,730 |
| 2022 | $31,089 | $132,730 | $69,000 | $63,730 |
| 2021 | $6,456 | $0 | $0 | $0 |
| 2020 | $6,438 | $57,500 | $39,200 | $18,300 |
| 2019 | $6,518 | $58,808 | $39,200 | $19,608 |
| 2018 | $6,655 | $588,080 | $0 | $0 |
| 2017 | $6,086 | $588,040 | $0 | $0 |
| 2016 | $6,010 | $58,804 | $0 | $0 |
| 2015 | $5,440 | $0 | $0 | $0 |
| 2014 | $5,440 | $1,388,700 | $840,000 | $548,700 |
| 2012 | -- | $1,388,700 | $840,000 | $548,700 |
Source: Public Records
Map
Nearby Homes
- 59 Nautica Way
- 160 Colony Pointe Dr
- 2987 Luvan Blvd
- 491 Blue Heron Dr
- 250 Pinckney Ln
- 58 Swan Point Trail
- Lot 173 Sanderling Ave
- 110 Swan Point Trail
- 15 Pinckney Ln
- Lot 120 Calais Ave
- 302 Colony Club Dr Unit LOT 19 COLONY CLUB P
- Lot 320 Wallace Pate Dr Unit Lot 320 Wallace Pate
- Lot 305 Wallace Pate Dr Unit Lot 305 and 1/2 Lot
- Lot 39 Jutland Ln Unit DeBordieu Colony
- 261 Marsh Lake Dr Unit 19
- 703 Collins Meadow Dr
- 191 Marsh Lake Dr Unit 25
- 54 Brandon Way
- 213 Old Carriage Loop
- 34 Dune Oaks Dr Unit DeBordieu Colony
- 2770 Luvan Blvd Unit DeBordieu Colony Mai
- 2750 Luvan Blvd
- 2790 Luvan Blvd
- 2790 Luvan Blvd Unit Lot 4, Salt Creek Ba
- 2732 Luvan Blvd Unit PER
- 2732 Luvan Blvd
- 2732 Luvan Blvd Unit LOT 1 SALT CREEK BAN
- 2824 Luvan Blvd
- Lot 18 Luvan Blvd
- Lot 18 Luvan Blvd Unit Lot 18 LaBruce Pond
- 2844 Luvan Blvd
- 2731 Luvan Blvd
- 2731 Luvan Blvd Unit Lakefront
- 2877 Luvan Blvd
- 2775 Luvan Blvd
- 2839 Luvan Blvd
- 2968 Luvan Blvd
- 2696 Luvan Blvd
- 2696 Luvan Blvd Unit Lot B, Marsh Point
- 2671 Luvan Blvd Unit DeBordieu Colony - W
Your Personal Tour Guide
Ask me questions while you tour the home.