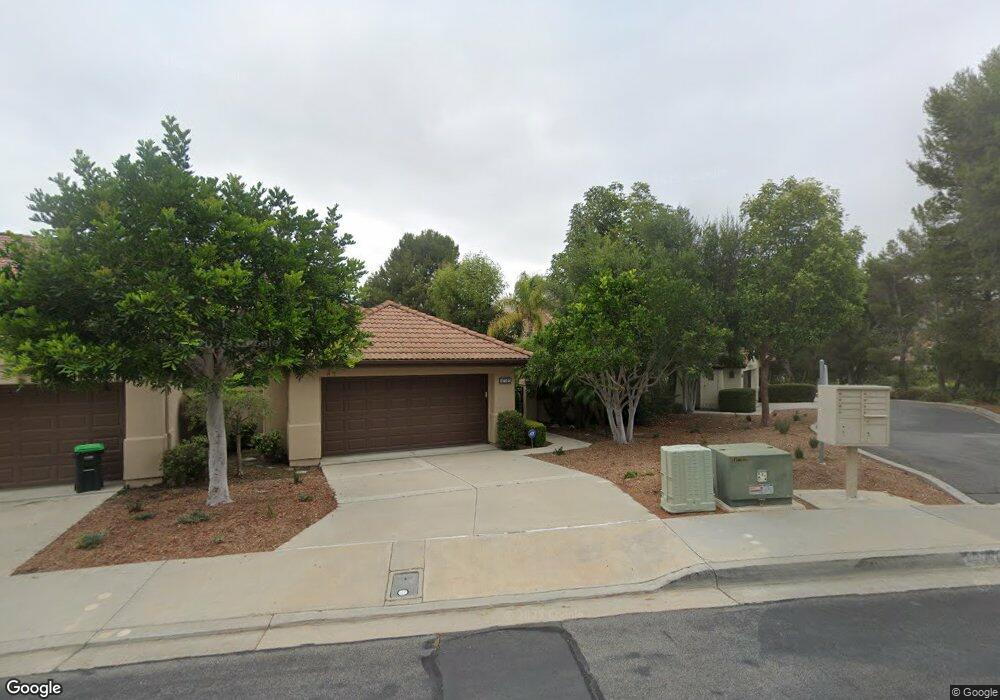
27707 Via Sequoia Unit 5 San Juan Capistrano, CA 92675
San Juan Hills NeighborhoodEstimated Value: $1,055,629 - $1,308,000
3
Beds
2
Baths
1,463
Sq Ft
$787/Sq Ft
Est. Value
About This Home
This home is located at 27707 Via Sequoia Unit 5, San Juan Capistrano, CA 92675 and is currently estimated at $1,151,657, approximately $787 per square foot. 27707 Via Sequoia Unit 5 is a home located in Orange County with nearby schools including Harold Ambuehl Elementary School, Marco Forster Middle School, and San Juan Hills High School.
Ownership History
Date
Name
Owned For
Owner Type
Purchase Details
Closed on
Jul 15, 2015
Sold by
Anderson Barbara A
Bought by
Anderson Barbara A and The Richard & Barbara Anderson Trust
Current Estimated Value
Home Financials for this Owner
Home Financials are based on the most recent Mortgage that was taken out on this home.
Original Mortgage
$101,000
Outstanding Balance
$78,726
Interest Rate
3.85%
Mortgage Type
New Conventional
Estimated Equity
$1,072,931
Purchase Details
Closed on
Dec 6, 2010
Sold by
Anderson Richard R and Anderson Barbara A
Bought by
Anderson Richard and Anderson Barbara
Purchase Details
Closed on
Oct 28, 2004
Sold by
Anderson Richard R and Anderson Barbara A
Bought by
Anderson Richard R and Anderson Barbara A
Purchase Details
Closed on
Jan 10, 1995
Sold by
Ccl Realty Ltd
Bought by
Anderson Richard R and Anderson Barbara A
Create a Home Valuation Report for This Property
The Home Valuation Report is an in-depth analysis detailing your home's value as well as a comparison with similar homes in the area
Home Values in the Area
Average Home Value in this Area
Purchase History
| Date | Buyer | Sale Price | Title Company |
|---|---|---|---|
| Anderson Barbara A | -- | None Available | |
| Anderson Barbara A | -- | Servicelink | |
| Anderson Richard | -- | None Available | |
| Anderson Richard R | -- | -- | |
| Anderson Richard R | $233,000 | First American Title Ins |
Source: Public Records
Mortgage History
| Date | Status | Borrower | Loan Amount |
|---|---|---|---|
| Open | Anderson Barbara A | $101,000 |
Source: Public Records
Tax History Compared to Growth
Tax History
| Year | Tax Paid | Tax Assessment Tax Assessment Total Assessment is a certain percentage of the fair market value that is determined by local assessors to be the total taxable value of land and additions on the property. | Land | Improvement |
|---|---|---|---|---|
| 2025 | $1,068 | $80,608 | $66,675 | $13,933 |
| 2024 | $1,068 | $79,028 | $65,368 | $13,660 |
| 2023 | $1,000 | $77,479 | $64,086 | $13,393 |
| 2022 | $726 | $75,960 | $62,829 | $13,131 |
| 2021 | $711 | $74,471 | $61,597 | $12,874 |
| 2020 | $704 | $73,708 | $60,966 | $12,742 |
| 2019 | $690 | $72,263 | $59,770 | $12,493 |
| 2018 | $676 | $70,847 | $58,598 | $12,249 |
| 2017 | $668 | $69,458 | $57,449 | $12,009 |
| 2016 | $655 | $68,097 | $56,323 | $11,774 |
| 2015 | $644 | $67,075 | $55,477 | $11,598 |
| 2014 | $631 | $65,762 | $54,391 | $11,371 |
Source: Public Records
Map
Nearby Homes
- 27782 Via Madrina
- 27507 Via Sequoia
- 32055 Via Canela
- 28257 Via Del Mar
- 27485 Paseo Amador Unit 5
- 27477 Paseo Amador
- 27252 Via Callejon
- 27369 Paseo Placentia Unit 31
- 27369 Paseo la Serna
- 28051 Calle Santa Ynez
- 27172 Paseo Burladero Unit C
- 27151 Via Chicuelina Unit B
- 31645 Rancho Viejo Rd
- 27681 Paseo Esteban
- 31232 Calle Bolero
- 28481 Avenida la Mancha
- 31262 Avenida Terramar
- 27281 Calle de la Rosa
- 31062 Casa Grande Dr
- 31192 Via Cordova
- 27719 Via Sequoia Unit 4
- 27725 Via Sequoia Unit 3
- 27701 Via Sequoia Unit 6
- 27737 Via Sequoia
- 27695 Via Sequoia Unit 7
- 27689 Via Sequoia Unit 8
- 27743 Via Sequoia Unit 1
- 27683 Via Sequoia
- 27677 Via Sequoia Unit 2
- 27677 Via Sequoia
- 27791 Camino Del Rio
- 27671 Via Sequoia Unit 3
- 27679 Paseo Alondra Unit 38
- 27677 Paseo Alondra
- 27665 Via Sequoia
- 27801 Camino Del Rio
- 27671 Paseo Alondra
- 27811 Camino Del Rio Unit 87
- 27665 Paseo Alondra
- 27659 Via Sequoia