2771 Alpine Creek Rd Unit 1 Reno, NV 89519
Lakeridge NeighborhoodEstimated Value: $569,231 - $653,000
2
Beds
3
Baths
1,483
Sq Ft
$410/Sq Ft
Est. Value
About This Home
This home is located at 2771 Alpine Creek Rd Unit 1, Reno, NV 89519 and is currently estimated at $608,058, approximately $410 per square foot. 2771 Alpine Creek Rd Unit 1 is a home located in Washoe County with nearby schools including Huffaker Elementary School, Edward L Pine Middle School, and Reno High School.
Ownership History
Date
Name
Owned For
Owner Type
Purchase Details
Closed on
Oct 26, 2020
Sold by
Houge Steven E
Bought by
Littlefield Dane
Current Estimated Value
Home Financials for this Owner
Home Financials are based on the most recent Mortgage that was taken out on this home.
Original Mortgage
$315,000
Outstanding Balance
$280,305
Interest Rate
2.8%
Mortgage Type
New Conventional
Estimated Equity
$327,753
Purchase Details
Closed on
Apr 5, 2011
Sold by
Berry Judit
Bought by
Houge Steven E
Purchase Details
Closed on
Aug 25, 2005
Sold by
Selleck Thomas W
Bought by
Houge Steven E and Houge Judit Barry
Home Financials for this Owner
Home Financials are based on the most recent Mortgage that was taken out on this home.
Original Mortgage
$288,000
Interest Rate
6%
Mortgage Type
Unknown
Create a Home Valuation Report for This Property
The Home Valuation Report is an in-depth analysis detailing your home's value as well as a comparison with similar homes in the area
Home Values in the Area
Average Home Value in this Area
Purchase History
| Date | Buyer | Sale Price | Title Company |
|---|---|---|---|
| Littlefield Dane | $425,000 | First Centennial Title Reno | |
| Houge Steven E | $360,000 | None Available | |
| Houge Steven E | $360,000 | First American Title |
Source: Public Records
Mortgage History
| Date | Status | Borrower | Loan Amount |
|---|---|---|---|
| Open | Littlefield Dane | $315,000 | |
| Previous Owner | Houge Steven E | $288,000 |
Source: Public Records
Tax History Compared to Growth
Tax History
| Year | Tax Paid | Tax Assessment Tax Assessment Total Assessment is a certain percentage of the fair market value that is determined by local assessors to be the total taxable value of land and additions on the property. | Land | Improvement |
|---|---|---|---|---|
| 2025 | $2,203 | $89,476 | $44,730 | $44,746 |
| 2024 | $2,203 | $90,084 | $44,380 | $45,704 |
| 2023 | $1,551 | $87,229 | $43,610 | $43,619 |
| 2022 | $2,075 | $68,913 | $32,375 | $36,538 |
| 2021 | $2,079 | $61,954 | $25,270 | $36,684 |
| 2020 | $1,953 | $62,322 | $25,270 | $37,052 |
| 2019 | $1,896 | $60,657 | $24,745 | $35,912 |
| 2018 | $1,841 | $57,835 | $22,365 | $35,470 |
| 2017 | $1,787 | $51,636 | $15,890 | $35,746 |
| 2016 | $1,742 | $53,202 | $16,590 | $36,612 |
| 2015 | $1,739 | $50,094 | $13,230 | $36,864 |
| 2014 | $1,688 | $48,181 | $12,530 | $35,651 |
| 2013 | -- | $44,689 | $9,590 | $35,099 |
Source: Public Records
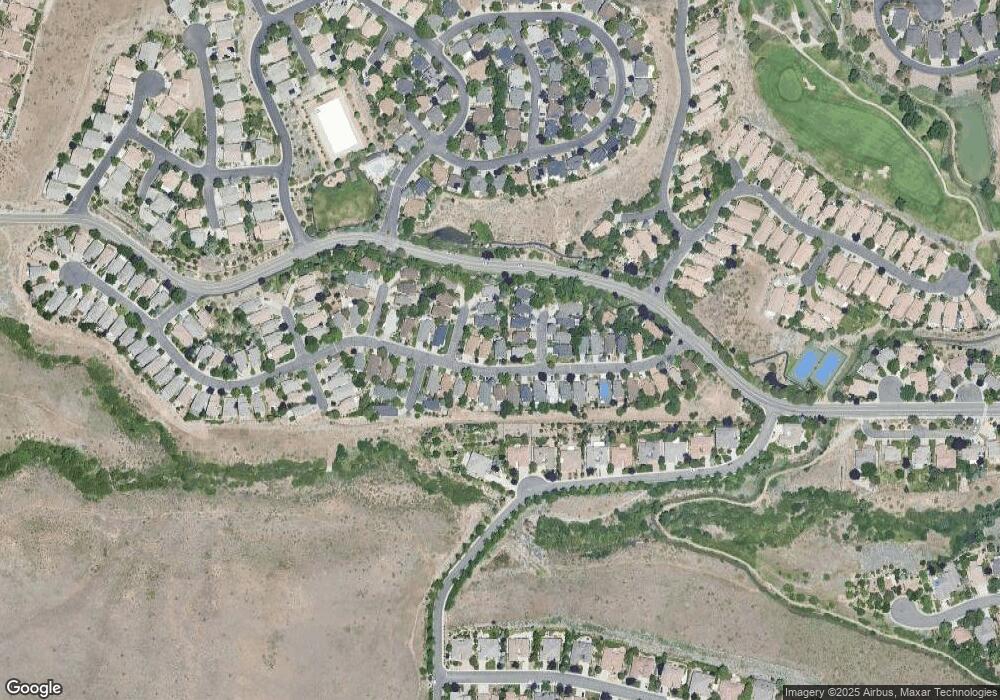
Map
Nearby Homes
- 2922 Aspen Meadows Ct
- 6215 Sunrise Meadows Loop
- 6225 S Deer Meadows Ct Unit SIX
- 6170 N Deer Meadows Ct
- 2678 Starr Meadows Loop
- 6248 Golden Meadow Rd
- 2652 Starr Meadows Loop
- 2520 Granite Springs Rd
- 2815 Lakeridge Shores E
- 2820 E Lake Ridge
- 3166 Vista Favoloso
- 6194 Laurelwood Dr
- 6190 Carriage House Way
- 5360 Bellazza Ct
- 6435 Meadow Valley Ln
- 6161 Wycliffe Cir
- 6525 Monticello Ct
- 5140 Belsera Ct
- 2521 Lake Ridge Shores Cir
- 2570 Spinnaker Dr
- 2805 Alpine Creek Rd
- 6351 Woods Creek Ct Unit 1
- 6341 Woods Creek Ct
- 6334 Echo Creek Ct
- 6333 Woods Creek Ct
- 2845 Alpine Creek Rd
- 6324 Echo Creek Ct
- 6327 Woods Creek Ct
- 2776 Alpine Creek Rd
- 2746 Alpine Creek Rd Unit 1
- 2800 Alpine Creek Rd
- 6314 Echo Creek Ct
- 2726 Alpine Creek Rd
- 2820 Alpine Creek Rd Unit 1
- 2840 Alpine Creek Rd
- 6311 Woods Creek Ct
- 2700 Alpine Creek Rd
- 2895 Alpine Creek Rd
- 6342 Woods Creek Ct
- 6350 Woods Creek Ct