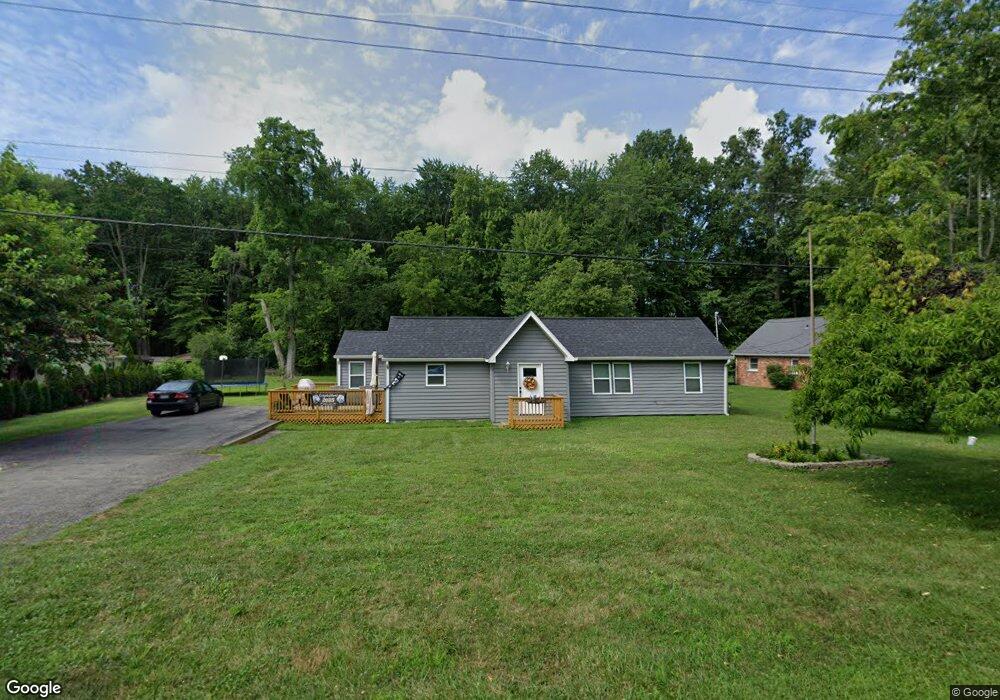
2771 Old State Route 32 Batavia, OH 45103
Estimated Value: $252,667 - $297,000
3
Beds
2
Baths
1,354
Sq Ft
$205/Sq Ft
Est. Value
About This Home
This home is located at 2771 Old State Route 32, Batavia, OH 45103 and is currently estimated at $277,417, approximately $204 per square foot. 2771 Old State Route 32 is a home located in Clermont County with nearby schools including Williamsburg Elementary School and Williamsburg High School.
Ownership History
Date
Name
Owned For
Owner Type
Purchase Details
Closed on
May 28, 2021
Sold by
Fry Paul and Fry Gladys M
Bought by
Chestnut Steven
Current Estimated Value
Home Financials for this Owner
Home Financials are based on the most recent Mortgage that was taken out on this home.
Original Mortgage
$216,015
Outstanding Balance
$195,575
Interest Rate
2.9%
Mortgage Type
FHA
Estimated Equity
$81,842
Purchase Details
Closed on
Nov 29, 2016
Sold by
Scott Marsha
Bought by
Fry Paul and Fry Gladys M
Purchase Details
Closed on
Jul 15, 2016
Sold by
Nichols Elaine Clair
Bought by
Nichols Elaine C and The Nichols Family Living Trust
Purchase Details
Closed on
May 16, 2008
Sold by
Wright Joseph M and Wright Jennifer
Bought by
Wright Christopher J and Wright Charity N
Home Financials for this Owner
Home Financials are based on the most recent Mortgage that was taken out on this home.
Original Mortgage
$96,490
Interest Rate
5.87%
Mortgage Type
FHA
Create a Home Valuation Report for This Property
The Home Valuation Report is an in-depth analysis detailing your home's value as well as a comparison with similar homes in the area
Purchase History
| Date | Buyer | Sale Price | Title Company |
|---|---|---|---|
| Chestnut Steven | $220,000 | Mattingly Ford Ttl Svcs Llc | |
| Fry Paul | $125 | Republic Title Agency | |
| Nichols Elaine C | $125 | None Available | |
| Wright Christopher J | $98,000 | Attorney |
Source: Public Records
Mortgage History
| Date | Status | Borrower | Loan Amount |
|---|---|---|---|
| Open | Chestnut Steven | $216,015 | |
| Previous Owner | Wright Christopher J | $96,490 |
Source: Public Records
Tax History
| Year | Tax Paid | Tax Assessment Tax Assessment Total Assessment is a certain percentage of the fair market value that is determined by local assessors to be the total taxable value of land and additions on the property. | Land | Improvement |
|---|---|---|---|---|
| 2024 | $2,045 | $50,230 | $8,370 | $41,860 |
| 2023 | $2,049 | $50,230 | $8,370 | $41,860 |
| 2022 | $1,858 | $40,990 | $6,830 | $34,160 |
| 2021 | $1,094 | $27,060 | $6,830 | $20,230 |
| 2020 | $1,096 | $27,060 | $6,830 | $20,230 |
| 2019 | $1,037 | $24,920 | $6,650 | $18,270 |
| 2018 | $1,039 | $24,920 | $6,650 | $18,270 |
| 2017 | $598 | $24,920 | $6,650 | $18,270 |
| 2016 | $598 | $21,670 | $5,780 | $15,890 |
| 2015 | $576 | $21,670 | $5,780 | $15,890 |
| 2014 | $575 | $21,670 | $5,780 | $15,890 |
| 2013 | $742 | $25,170 | $6,300 | $18,870 |
Source: Public Records
Map
Nearby Homes
- 4145 Half Acre Rd
- 0 Curliss Ln
- 4325 Half-Acre Rd
- 3 James E Sauls Sr Dr
- 4 James E Sauls Sr Dr
- 2 James E Sauls Sr Dr
- 2100 James E Sauls Sr Dr
- 3381 Dewdrop Way
- 3389 Dewdrop Way
- 3368 Dewdrop Way
- 3357 Sunbeam Place
- 3423 Spring Harvest Dr
- 2064 Wild Berry Way
- 3336 Sunbeam Place
- 2080 Wildberry Way
- ac Summit Rd
- 2472 Streamside Dr
- 2400 Bridgewater Dr
- 243 #R Bridgewater Dr
- 555 Spring St
- 2771 Old St Rt 32
- 2775 Old State Route 32
- 2769 Old State Route 32
- 2781 Old State Route 32
- 2766 Old State Route 32
- 2765 Old State Route 32
- 2791 Old State Route 32
- 4091 Afton Elklick Rd
- 2761 Old State Route 32
- 2757 Old State Route 32
- 2757 Old St Rt 32
- 2763 Old State Route 32
- 2763 Old State Route 32
- 5000 Afton Elklick Rd
- 4121 Half-Acre Rd
- 4125 Half Acre Rd
- 4125 Half Acre Rd
- 2756 Old State Route 32
- 2754 Old State Route 32
- 4073 Afton Elklick Rd
Your Personal Tour Guide
Ask me questions while you tour the home.