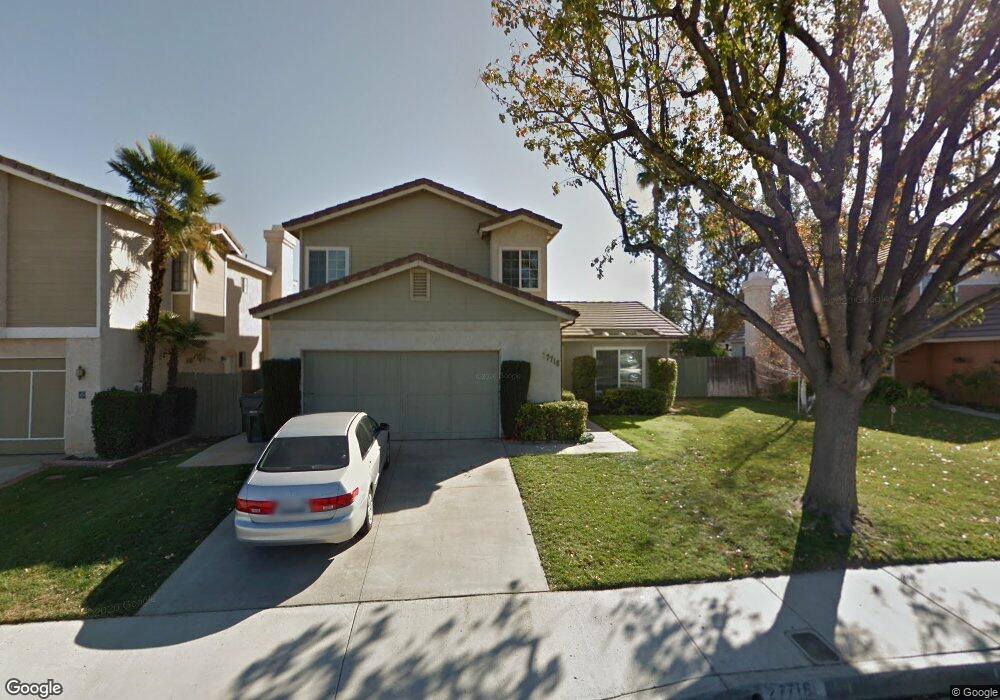
27716 Saddleridge Way Castaic, CA 91384
Estimated Value: $742,437 - $819,000
3
Beds
3
Baths
1,522
Sq Ft
$508/Sq Ft
Est. Value
About This Home
This home is located at 27716 Saddleridge Way, Castaic, CA 91384 and is currently estimated at $773,609, approximately $508 per square foot. 27716 Saddleridge Way is a home located in Los Angeles County with nearby schools including Live Oak Elementary School, Castaic Middle School, and Valencia High School.
Ownership History
Date
Name
Owned For
Owner Type
Purchase Details
Closed on
Jul 2, 2003
Sold by
Vargas Nancy
Bought by
Vargas Jose
Current Estimated Value
Home Financials for this Owner
Home Financials are based on the most recent Mortgage that was taken out on this home.
Original Mortgage
$66,000
Interest Rate
5.17%
Mortgage Type
Stand Alone Second
Purchase Details
Closed on
Jun 25, 2003
Sold by
Miura Doug
Bought by
Vargas Jose
Home Financials for this Owner
Home Financials are based on the most recent Mortgage that was taken out on this home.
Original Mortgage
$66,000
Interest Rate
5.17%
Mortgage Type
Stand Alone Second
Purchase Details
Closed on
Aug 25, 1998
Sold by
Sumrow Jerald W
Bought by
Miura Doug and Miura Kristi
Home Financials for this Owner
Home Financials are based on the most recent Mortgage that was taken out on this home.
Original Mortgage
$190,000
Interest Rate
6.88%
Create a Home Valuation Report for This Property
The Home Valuation Report is an in-depth analysis detailing your home's value as well as a comparison with similar homes in the area
Home Values in the Area
Average Home Value in this Area
Purchase History
| Date | Buyer | Sale Price | Title Company |
|---|---|---|---|
| Vargas Jose | -- | Fswt | |
| Vargas Jose | $330,000 | Fswt | |
| Miura Doug | $200,000 | Investors Title Company |
Source: Public Records
Mortgage History
| Date | Status | Borrower | Loan Amount |
|---|---|---|---|
| Closed | Vargas Jose | $66,000 | |
| Open | Vargas Jose | $264,000 | |
| Previous Owner | Miura Doug | $190,000 |
Source: Public Records
Tax History Compared to Growth
Tax History
| Year | Tax Paid | Tax Assessment Tax Assessment Total Assessment is a certain percentage of the fair market value that is determined by local assessors to be the total taxable value of land and additions on the property. | Land | Improvement |
|---|---|---|---|---|
| 2025 | $6,353 | $469,166 | $278,232 | $190,934 |
| 2024 | $6,353 | $459,968 | $272,777 | $187,191 |
| 2023 | $6,028 | $450,950 | $267,429 | $183,521 |
| 2022 | $5,922 | $442,109 | $262,186 | $179,923 |
| 2021 | $5,807 | $433,442 | $257,046 | $176,396 |
| 2019 | $5,590 | $420,588 | $249,423 | $171,165 |
| 2018 | $5,888 | $412,342 | $244,533 | $167,809 |
| 2016 | $5,400 | $396,333 | $235,039 | $161,294 |
| 2015 | $5,350 | $390,381 | $231,509 | $158,872 |
| 2014 | $5,269 | $382,735 | $226,975 | $155,760 |
Source: Public Records
Map
Nearby Homes
- 29133 Diablo Place
- 29124 Rangewood Rd
- 27865 Quincy St
- 27763 Wakefield Rd
- 29720 Creekbed Rd
- 27604 Firebrand Dr
- 28238 Alton Way
- 28306 Millbrook Place
- 28120 Gibraltar Ln
- 28328 Alton Way
- 28348 Millbrook Place
- 27745 Desert Place
- 29918 Crawford Place
- 29810 Glendower Ct
- 29884 Cashmere Place
- 29908 Cambridge Ave
- 29965 Crawford Place
- 27922 Bridlewood Dr
- 27625 Moonlight Place
- 30103 Desert Rose Dr
- 27710 Saddleridge Way
- 27720 Saddleridge Way
- 27721 Buckskin Dr
- 27706 Saddleridge Way
- 27725 Buckskin Dr
- 27715 Buckskin Dr
- 27728 Saddleridge Way
- 27711 Buckskin Dr
- 27741 Buckskin Dr
- 27702 Saddleridge Way
- 27731 Buckskin Dr
- 27707 Buckskin Dr
- 27734 Saddleridge Way
- 27749 Buckskin Dr
- 27740 Saddleridge Way
- 27722 Buckskin Dr
- 27718 Buckskin Dr
- 27755 Buckskin Dr
- 27728 Buckskin Dr
- 27712 Buckskin Dr