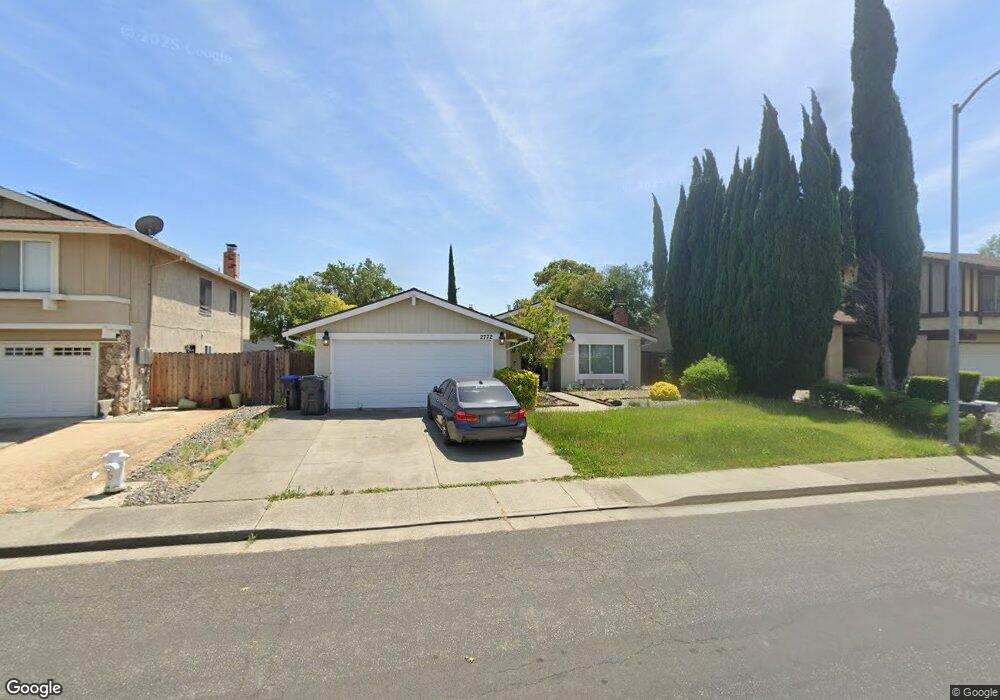
2772 Elmhurst Cir Fairfield, CA 94533
Estimated Value: $471,000 - $511,000
3
Beds
2
Baths
1,296
Sq Ft
$375/Sq Ft
Est. Value
About This Home
This home is located at 2772 Elmhurst Cir, Fairfield, CA 94533 and is currently estimated at $486,630, approximately $375 per square foot. 2772 Elmhurst Cir is a home located in Solano County with nearby schools including Dover Elementary School, Grange Middle School, and Fairfield High School.
Ownership History
Date
Name
Owned For
Owner Type
Purchase Details
Closed on
Jun 8, 2015
Sold by
Colfin Ah California 7 Llc
Bought by
Cah 2015-1 Borrower Llc
Current Estimated Value
Purchase Details
Closed on
Feb 4, 2014
Sold by
Popyon Lenee
Bought by
Colfin Ah California 7 Llc
Purchase Details
Closed on
Jan 8, 2013
Sold by
Popyon Lenee and Popyon Lenee Elizabeth
Bought by
Popyon Lenee Elizabeth
Purchase Details
Closed on
Jan 24, 2002
Sold by
Popyon Edward
Bought by
Popyon Lenee
Home Financials for this Owner
Home Financials are based on the most recent Mortgage that was taken out on this home.
Original Mortgage
$182,400
Interest Rate
7.17%
Purchase Details
Closed on
Sep 28, 2000
Sold by
Kirchner Ronald A and Kirchner J E
Bought by
Popyon Lenee and Popyon Edward
Home Financials for this Owner
Home Financials are based on the most recent Mortgage that was taken out on this home.
Original Mortgage
$173,837
Interest Rate
8.01%
Mortgage Type
FHA
Create a Home Valuation Report for This Property
The Home Valuation Report is an in-depth analysis detailing your home's value as well as a comparison with similar homes in the area
Home Values in the Area
Average Home Value in this Area
Purchase History
| Date | Buyer | Sale Price | Title Company |
|---|---|---|---|
| Cah 2015-1 Borrower Llc | -- | Fidelity Natl Title Group | |
| Colfin Ah California 7 Llc | $214,100 | None Available | |
| Popyon Lenee Elizabeth | -- | None Available | |
| Popyon Lenee | $86,500 | Placer Title Company | |
| Popyon Lenee | $175,000 | -- |
Source: Public Records
Mortgage History
| Date | Status | Borrower | Loan Amount |
|---|---|---|---|
| Previous Owner | Popyon Lenee | $182,400 | |
| Previous Owner | Popyon Lenee | $173,837 |
Source: Public Records
Tax History Compared to Growth
Tax History
| Year | Tax Paid | Tax Assessment Tax Assessment Total Assessment is a certain percentage of the fair market value that is determined by local assessors to be the total taxable value of land and additions on the property. | Land | Improvement |
|---|---|---|---|---|
| 2025 | $3,818 | $384,580 | $118,331 | $266,249 |
| 2024 | $3,818 | $334,242 | $92,843 | $241,399 |
| 2023 | $3,700 | $327,689 | $91,023 | $236,666 |
| 2022 | $3,655 | $321,265 | $89,239 | $232,026 |
| 2021 | $3,620 | $314,967 | $87,490 | $227,477 |
| 2020 | $3,535 | $311,738 | $86,593 | $225,145 |
| 2019 | $3,448 | $305,627 | $84,896 | $220,731 |
| 2018 | $3,559 | $299,635 | $83,232 | $216,403 |
| 2017 | $3,395 | $272,508 | $52,811 | $219,697 |
| 2016 | $3,126 | $267,166 | $51,776 | $215,390 |
| 2015 | $2,918 | $263,154 | $50,999 | $212,155 |
| 2014 | $2,336 | $215,115 | $61,462 | $153,653 |
Source: Public Records
Map
Nearby Homes
- 2827 Sunburst Dr
- 424 Chelsea Way
- 2915 N Texas St Unit 219
- 2915 N Texas St Unit 234
- 558 Maywood Way
- 257 Holly Dr
- 2564 Sunrise Dr
- 722 Rosemary Ct
- 675 Hillside Dr
- 2806 Marigold Dr
- 730 Capricorn Cir
- 727 Shamrock Ct
- 223 Camellia St
- 3101 Arroyo Ct
- 2968 Juniper St
- 241 Camellia St
- 3265 Arroyo Dr
- 3276 Arroyo Dr
- 2734 Laurel Dr
- 205 Alaska Ave
- 2778 Elmhurst Cir
- 2766 Elmhurst Cir
- 2784 Elmhurst Cir
- 430 Blakemore Ct
- 446 Blakemore Ct
- 2760 Elmhurst Cir
- 2775 Elmhurst Cir
- 454 Blakemore Ct
- 2769 Elmhurst Cir
- 422 Blakemore Ct
- 2790 Elmhurst Cir
- 2763 Elmhurst Cir
- 2787 Elmhurst Cir
- 462 Blakemore Ct
- 414 Blakemore Ct
- 2791 Elmhurst Cir
- 2757 Elmhurst Cir
- 447 Blakemore Ct
- 455 Blakemore Ct