Estimated Value: $425,000 - $532,000
4
Beds
3
Baths
2,116
Sq Ft
$235/Sq Ft
Est. Value
About This Home
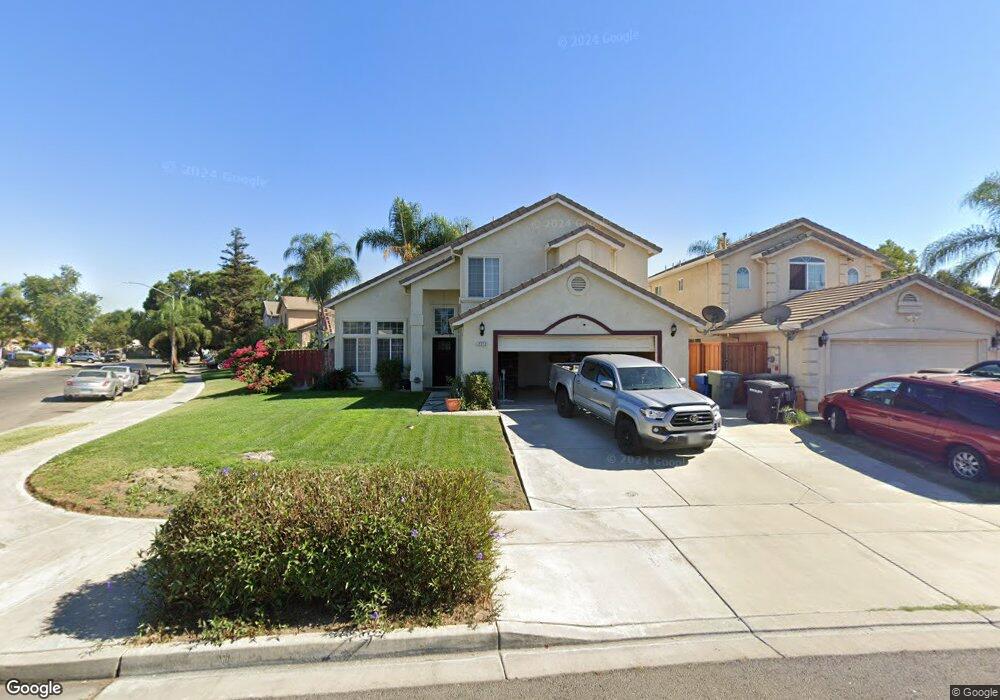
This home is located at 2772 Sundale Dr, Ceres, CA 95307 and is currently estimated at $496,381, approximately $234 per square foot. 2772 Sundale Dr is a home located in Stanislaus County with nearby schools including Sinclear Elementary School, Blaker-Kinser Junior High School, and Central Valley High School.
Ownership History
Date
Name
Owned For
Owner Type
Purchase Details
Closed on
Dec 21, 2006
Sold by
Gayaneshwar Narendra
Bought by
Gayaneshwar Narendra and Gyan Sunil
Current Estimated Value
Home Financials for this Owner
Home Financials are based on the most recent Mortgage that was taken out on this home.
Original Mortgage
$49,069
Outstanding Balance
$29,191
Interest Rate
6.22%
Mortgage Type
Credit Line Revolving
Estimated Equity
$467,190
Purchase Details
Closed on
Oct 6, 2004
Sold by
Westpointe Estates Iii
Bought by
Gayaneshwar Narendra and Gyan Sunil
Home Financials for this Owner
Home Financials are based on the most recent Mortgage that was taken out on this home.
Original Mortgage
$227,150
Outstanding Balance
$113,361
Interest Rate
5.99%
Mortgage Type
Purchase Money Mortgage
Estimated Equity
$383,020
Create a Home Valuation Report for This Property
The Home Valuation Report is an in-depth analysis detailing your home's value as well as a comparison with similar homes in the area
Purchase History
| Date | Buyer | Sale Price | Title Company |
|---|---|---|---|
| Gayaneshwar Narendra | -- | Old Republic Title Company | |
| Gayaneshwar Narendra | $284,000 | Alliance Title Company |
Source: Public Records
Mortgage History
| Date | Status | Borrower | Loan Amount |
|---|---|---|---|
| Open | Gayaneshwar Narendra | $49,069 | |
| Open | Gayaneshwar Narendra | $227,150 | |
| Closed | Gayaneshwar Narendra | $35,000 |
Source: Public Records
Tax History
| Year | Tax Paid | Tax Assessment Tax Assessment Total Assessment is a certain percentage of the fair market value that is determined by local assessors to be the total taxable value of land and additions on the property. | Land | Improvement |
|---|---|---|---|---|
| 2025 | $4,630 | $395,853 | $104,534 | $291,319 |
| 2024 | $4,342 | $388,092 | $102,485 | $285,607 |
| 2023 | $4,224 | $380,483 | $100,476 | $280,007 |
| 2022 | $4,187 | $373,023 | $98,506 | $274,517 |
| 2021 | $4,144 | $365,710 | $96,575 | $269,135 |
| 2020 | $4,017 | $361,961 | $95,585 | $266,376 |
| 2019 | $3,990 | $354,864 | $93,711 | $261,153 |
| 2018 | $3,907 | $347,907 | $91,874 | $256,033 |
| 2017 | $3,493 | $307,500 | $95,000 | $212,500 |
| 2016 | $3,273 | $288,500 | $60,000 | $228,500 |
| 2015 | $3,395 | $268,000 | $49,500 | $218,500 |
| 2014 | $3,139 | $243,500 | $45,000 | $198,500 |
Source: Public Records
Map
Nearby Homes
- 2800 Skybrite Dr
- 940 Allacante Dr
- 2617 E Whitmore Ave
- 3096 Castle Rock Ct
- 3449 Guru Dr
- 3116 Larrynell Dr
- 3651 San Juan Rd
- 3671 San Juan Rd
- 3501 Soda Canyon Dr
- 3816 Teek Ct
- 1429 Don Pedro Rd
- 1628 Sungate Dr
- 1734 Norwood Heights Ln
- 3816 Dano Ct
- 1717 Don Pedro Rd
- 921 Atlantic Dr
- 1823 Spokane St
- 505 Mount Everest Ct
- 1279 Montclaire Dr
- 3820 Drakewood Ct
- 2788 Sundale Dr
- 2816 Malik Ave
- 986 Moonlight Dr
- 961 Moonlight Dr
- 975 Moonlight Dr
- 2775 Sundale Dr
- 2822 Malik Ave
- 2789 Sundale Dr
- 1000 Moonlight Dr
- 2761 Sundale Dr
- 989 Moonlight Dr
- 2828 Malik Ave
- 1003 Moonlight Dr
- 2747 Sundale Dr
- 1014 Moonlight Dr
- 958 Sun Meadow Dr
- 972 Sun Meadow Dr
- 2789 Malik Ave
- 2772 Malik Ave
- 2758 Malik Ave
Your Personal Tour Guide
Ask me questions while you tour the home.