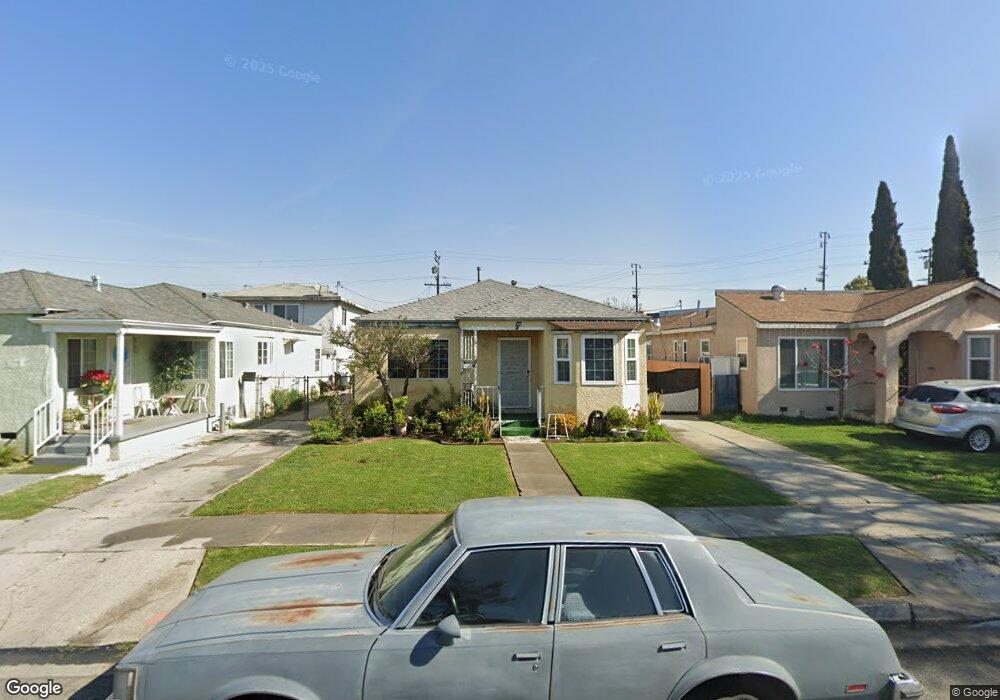
2773 Laurel Place South Gate, CA 90280
Estimated Value: $618,778 - $744,000
2
Beds
1
Bath
973
Sq Ft
$693/Sq Ft
Est. Value
About This Home
This home is located at 2773 Laurel Place, South Gate, CA 90280 and is currently estimated at $673,945, approximately $692 per square foot. 2773 Laurel Place is a home located in Los Angeles County with nearby schools including Willow Elementary, Southeast Middle School, and South Gate Middle School.
Ownership History
Date
Name
Owned For
Owner Type
Purchase Details
Closed on
Nov 11, 2021
Sold by
Orellana Jeannette and Argumedo Jorge A
Bought by
Orellana Jeannette and Argumedo Jorge
Current Estimated Value
Home Financials for this Owner
Home Financials are based on the most recent Mortgage that was taken out on this home.
Original Mortgage
$165,000
Outstanding Balance
$151,194
Interest Rate
2.99%
Mortgage Type
New Conventional
Estimated Equity
$522,751
Purchase Details
Closed on
Jun 17, 1998
Sold by
World Svgs Bank
Bought by
Orellana Jeannette
Home Financials for this Owner
Home Financials are based on the most recent Mortgage that was taken out on this home.
Original Mortgage
$128,783
Interest Rate
7.01%
Mortgage Type
FHA
Purchase Details
Closed on
Aug 7, 1997
Sold by
Sierra Francisco M and Sierra Consuelo
Bought by
World S & L Assn Fsla
Purchase Details
Closed on
Aug 4, 1994
Sold by
Sierra Francisco M and Sierra Consuelo
Bought by
Madrid Alicia
Create a Home Valuation Report for This Property
The Home Valuation Report is an in-depth analysis detailing your home's value as well as a comparison with similar homes in the area
Home Values in the Area
Average Home Value in this Area
Purchase History
| Date | Buyer | Sale Price | Title Company |
|---|---|---|---|
| Orellana Jeannette | -- | New Title Company Name | |
| Orellana Jeannette | $130,000 | Fidelity Title | |
| World S & L Assn Fsla | $138,608 | Stewart Title | |
| Madrid Alicia | -- | -- |
Source: Public Records
Mortgage History
| Date | Status | Borrower | Loan Amount |
|---|---|---|---|
| Open | Orellana Jeannette | $165,000 | |
| Previous Owner | Orellana Jeannette | $128,783 |
Source: Public Records
Tax History Compared to Growth
Tax History
| Year | Tax Paid | Tax Assessment Tax Assessment Total Assessment is a certain percentage of the fair market value that is determined by local assessors to be the total taxable value of land and additions on the property. | Land | Improvement |
|---|---|---|---|---|
| 2025 | $4,670 | $348,969 | $265,848 | $83,121 |
| 2024 | $4,670 | $342,128 | $260,636 | $81,492 |
| 2023 | $4,591 | $335,421 | $255,526 | $79,895 |
| 2022 | $2,802 | $191,880 | $125,410 | $66,470 |
| 2021 | $2,768 | $188,118 | $122,951 | $65,167 |
| 2019 | $2,686 | $182,540 | $119,305 | $63,235 |
| 2018 | $2,570 | $178,962 | $116,966 | $61,996 |
| 2016 | $2,453 | $172,015 | $112,425 | $59,590 |
| 2015 | $2,414 | $169,432 | $110,737 | $58,695 |
| 2014 | $2,418 | $166,114 | $108,568 | $57,546 |
Source: Public Records
Map
Nearby Homes
- 8648 Chestnut Ave
- 8680 Evergreen Ave
- 8669 Cypress Ave
- 2659 Independence Ave
- 2555 Cass Place
- 9320 Long Beach Blvd
- 2500 Illinois Ave
- 2565 Sale Place
- 2647 Kansas Ave
- 2485 Cass Place
- 2905 Kansas Ave
- 2927 Missouri Ave
- 2806 Cudahy St
- 2914 Missouri Ave
- 3175 Ohio Ave
- 9612 Long Beach Blvd
- 9616 Long Beach Blvd
- 2732 Indiana Ave
- 3130 Kansas Ave
- 3011 Indiana Ave
- 2771 Laurel Place
- 2779 Laurel Place
- 2783 Laurel Place
- 2789 Laurel Place
- 2786 Orchard Place
- 2782 Orchard Place
- 2790 Orchard Place
- 2751 Laurel Place
- 2776 Orchard Place
- 8715 Long Beach Blvd
- 2774 Orchard Place
- 8711 Long Beach Blvd
- 2774 Laurel Place
- 2770 Laurel Place
- 2766 Laurel Place
- 2780 Laurel Place
- 2770 Orchard Place
- 2784 Laurel Place
- 2766 Orchard Place
- 2747 Laurel Place