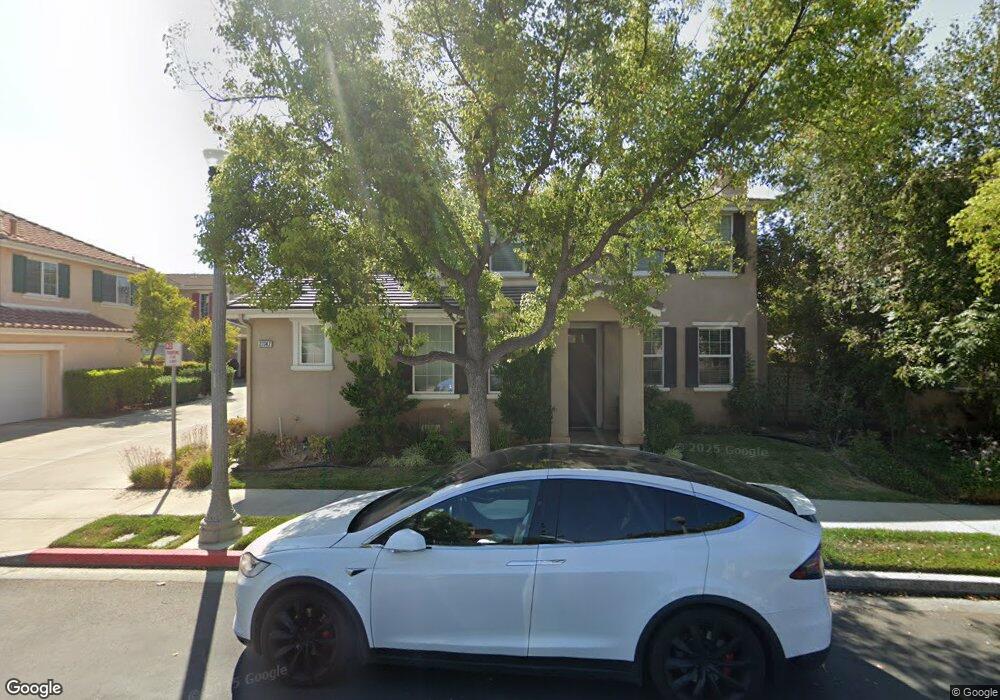
27747 Summer Grove Place Valencia, CA 91354
Estimated Value: $740,000 - $811,897
3
Beds
3
Baths
1,720
Sq Ft
$460/Sq Ft
Est. Value
About This Home
This home is located at 27747 Summer Grove Place, Valencia, CA 91354 and is currently estimated at $791,224, approximately $460 per square foot. 27747 Summer Grove Place is a home located in Los Angeles County with nearby schools including Charles Helmers Elementary School, Rio Norte Junior High School, and Valencia High School.
Ownership History
Date
Name
Owned For
Owner Type
Purchase Details
Closed on
May 16, 2011
Sold by
Nogle Gregory and Nogle Nicole
Bought by
Balcom Llc
Current Estimated Value
Purchase Details
Closed on
Mar 7, 2007
Sold by
Chambers Jacob
Bought by
Nogle Gregory and Nogle Nicole
Home Financials for this Owner
Home Financials are based on the most recent Mortgage that was taken out on this home.
Original Mortgage
$113,000
Interest Rate
6.13%
Mortgage Type
Credit Line Revolving
Purchase Details
Closed on
Feb 27, 2004
Sold by
Richmond American Homes Of Ca Inc
Bought by
Chambers Jacob
Home Financials for this Owner
Home Financials are based on the most recent Mortgage that was taken out on this home.
Original Mortgage
$287,168
Interest Rate
5%
Mortgage Type
New Conventional
Create a Home Valuation Report for This Property
The Home Valuation Report is an in-depth analysis detailing your home's value as well as a comparison with similar homes in the area
Home Values in the Area
Average Home Value in this Area
Purchase History
| Date | Buyer | Sale Price | Title Company |
|---|---|---|---|
| Balcom Llc | $300,000 | Lawyers Title Company | |
| Nogle Gregory | $565,000 | First Southwestern Title Co | |
| Chambers Jacob | $362,000 | First American Title Company |
Source: Public Records
Mortgage History
| Date | Status | Borrower | Loan Amount |
|---|---|---|---|
| Previous Owner | Nogle Gregory | $113,000 | |
| Previous Owner | Chambers Jacob | $287,168 |
Source: Public Records
Tax History Compared to Growth
Tax History
| Year | Tax Paid | Tax Assessment Tax Assessment Total Assessment is a certain percentage of the fair market value that is determined by local assessors to be the total taxable value of land and additions on the property. | Land | Improvement |
|---|---|---|---|---|
| 2025 | $5,608 | $384,342 | $175,260 | $209,082 |
| 2024 | $5,608 | $376,807 | $171,824 | $204,983 |
| 2023 | $5,419 | $369,419 | $168,455 | $200,964 |
| 2022 | $5,411 | $362,176 | $165,152 | $197,024 |
| 2021 | $5,293 | $355,075 | $161,914 | $193,161 |
| 2019 | $5,126 | $344,545 | $157,112 | $187,433 |
| 2018 | $4,940 | $337,790 | $154,032 | $183,758 |
| 2016 | $4,689 | $324,674 | $148,051 | $176,623 |
| 2015 | $4,529 | $319,798 | $145,828 | $173,970 |
| 2014 | $4,491 | $313,535 | $142,972 | $170,563 |
Source: Public Records
Map
Nearby Homes
- 27795 Summer Grove Place Unit PJ
- 27626 Sunny Creek Dr
- 24163 Arrowhead Ct
- 27976 Trillium Ln
- 27905 Crown Court Cir Unit 93
- 27955 Trillium Ln Unit 62
- 28058 Dickason Dr Unit 118
- 23809 Woodpark Ct
- 24136 Willowbrooke Ct
- 27879 Skycrest Cir Unit 28
- 24224 Edelweiss Ct
- 27950 Periwinkle Ln
- 27531 Sunny Creek Dr
- 28089 Promontory Ln
- 24323 Calle La Roca
- 24328 Calle La Roca
- 24331 Calle La Roca
- 24327 Calle La Roca
- 27831 Silverton Ct
- 27448 Bridgewater Dr
- 27745 Summer Grove Place Unit 27
- 27753 Summer Grove Place
- 27741 Summer Grove Place
- 27755 Summer Grove Place
- 27743 Summer Grove Place Unit 26
- 27742 Summer Grove Place
- 27748 Summer Grove Place
- 27739 Summer Grove Place
- 27737 Summer Grove Place
- 27757 Summer Grove Place
- 27740 Summer Grove Place
- 27744 Summer Grove Place
- 27835 Summer Grove Place
- 27841 Summer Grove Place
- 27761 Summer Grove Place
- 27827 Summer Grove Place
- 27813 Summer Grove Place
- 27796 Summer Grove Place
- 27759 Summer Grove Place
- 27746 Summer Grove Place