Estimated Value: $394,000 - $539,000
4
Beds
3
Baths
2,116
Sq Ft
$231/Sq Ft
Est. Value
About This Home
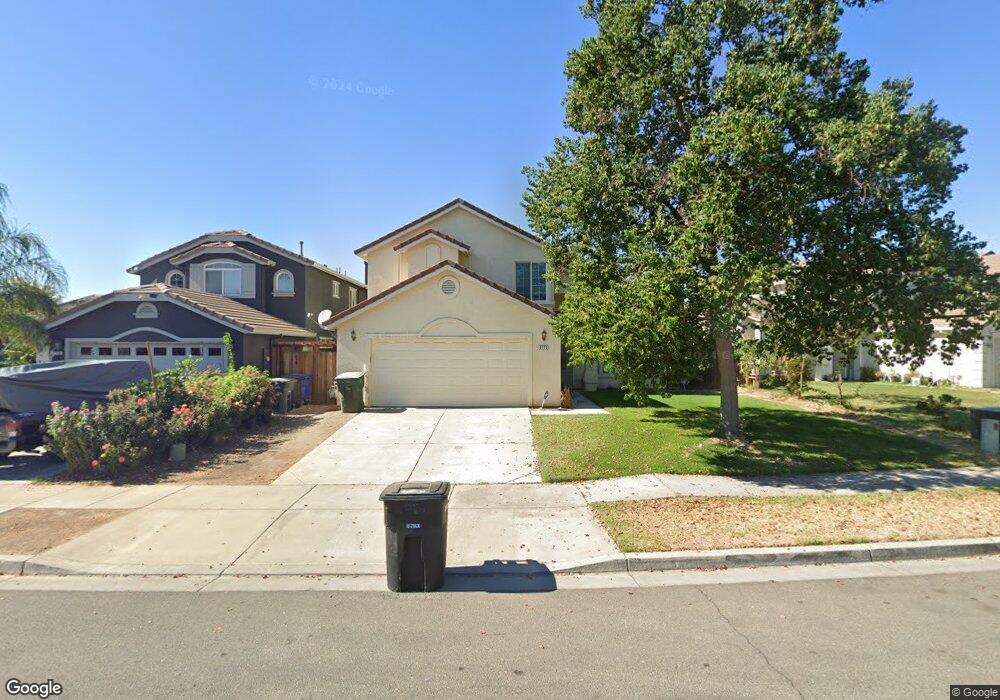
This home is located at 2775 Sundale Dr, Ceres, CA 95307 and is currently estimated at $487,917, approximately $230 per square foot. 2775 Sundale Dr is a home located in Stanislaus County with nearby schools including Sinclear Elementary School, Blaker-Kinser Junior High School, and Central Valley High School.
Ownership History
Date
Name
Owned For
Owner Type
Purchase Details
Closed on
Feb 16, 2021
Sold by
Smaltz James R and Johnson Iain
Bought by
Smaltz James R and Johnston Iain
Current Estimated Value
Purchase Details
Closed on
Mar 2, 2010
Sold by
Smaltz James R
Bought by
Smaltz James R and Johnston Iain
Purchase Details
Closed on
Feb 9, 2010
Sold by
Johnston Iain
Bought by
Smaltz James
Purchase Details
Closed on
Feb 2, 2010
Sold by
Bank Of America National Association
Bought by
Smaltz James
Purchase Details
Closed on
Nov 13, 2009
Sold by
Martinez Angel Sotelo
Bought by
Bank Of America National Association
Purchase Details
Closed on
Feb 8, 2007
Sold by
Westpointe Estates Iii
Bought by
Martinez Angel Sotelo
Home Financials for this Owner
Home Financials are based on the most recent Mortgage that was taken out on this home.
Original Mortgage
$319,960
Interest Rate
1.25%
Mortgage Type
Negative Amortization
Create a Home Valuation Report for This Property
The Home Valuation Report is an in-depth analysis detailing your home's value as well as a comparison with similar homes in the area
Purchase History
| Date | Buyer | Sale Price | Title Company |
|---|---|---|---|
| Smaltz James R | -- | None Available | |
| Smaltz James R | -- | None Available | |
| Smaltz James | -- | North American Title Company | |
| Smaltz James | $153,000 | None Available | |
| Bank Of America National Association | $152,915 | Stewart Title | |
| Martinez Angel Sotelo | $400,000 | Alliance Title Company |
Source: Public Records
Mortgage History
| Date | Status | Borrower | Loan Amount |
|---|---|---|---|
| Previous Owner | Martinez Angel Sotelo | $319,960 |
Source: Public Records
Tax History
| Year | Tax Paid | Tax Assessment Tax Assessment Total Assessment is a certain percentage of the fair market value that is determined by local assessors to be the total taxable value of land and additions on the property. | Land | Improvement |
|---|---|---|---|---|
| 2025 | $2,386 | $196,910 | $70,986 | $125,924 |
| 2024 | $2,241 | $193,050 | $69,595 | $123,455 |
| 2023 | $2,181 | $189,266 | $68,231 | $121,035 |
| 2022 | $2,162 | $185,556 | $66,894 | $118,662 |
| 2021 | $2,140 | $181,919 | $65,583 | $116,336 |
| 2020 | $2,075 | $180,055 | $64,911 | $115,144 |
| 2019 | $2,062 | $176,526 | $63,639 | $112,887 |
| 2018 | $2,020 | $173,066 | $62,392 | $110,674 |
| 2017 | $2,004 | $169,673 | $61,169 | $108,504 |
| 2016 | $1,964 | $166,347 | $59,970 | $106,377 |
| 2015 | $2,288 | $163,850 | $59,070 | $104,780 |
| 2014 | $2,254 | $160,641 | $57,913 | $102,728 |
Source: Public Records
Map
Nearby Homes
- 815 Starke Dr
- 2800 Skybrite Dr
- 940 Allacante Dr
- 2617 E Whitmore Ave
- 954 Avenida Real
- 3116 Larrynell Dr
- 3608 Cassie Ln
- 3501 Soda Canyon Dr
- 3816 Teek Ct
- 3005 Willetts Way
- 1440 Don Pedro Rd
- 1628 Sungate Dr
- 3816 Dano Ct
- 1825 Eureka St
- 921 Atlantic Dr
- 400 Imperial Ave
- 417 Mount Everest Ct
- 505 Mount Everest Ct
- 624 Park Hurst Way
- 414 Glenn Ave
- 2761 Sundale Dr
- 2789 Sundale Dr
- 2758 Malik Ave
- 2747 Sundale Dr
- 2772 Malik Ave
- 2744 Malik Ave
- 2772 Sundale Dr
- 961 Moonlight Dr
- 2788 Sundale Dr
- 2733 Sundale Dr
- 2730 Malik Ave
- 975 Moonlight Dr
- 958 Sun Meadow Dr
- 2719 Sundale Dr
- 2816 Malik Ave
- 2775 Malik Ave
- 2761 Malik Ave
- 986 Moonlight Dr
- 2747 Malik Ave
- 2789 Malik Ave
Your Personal Tour Guide
Ask me questions while you tour the home.