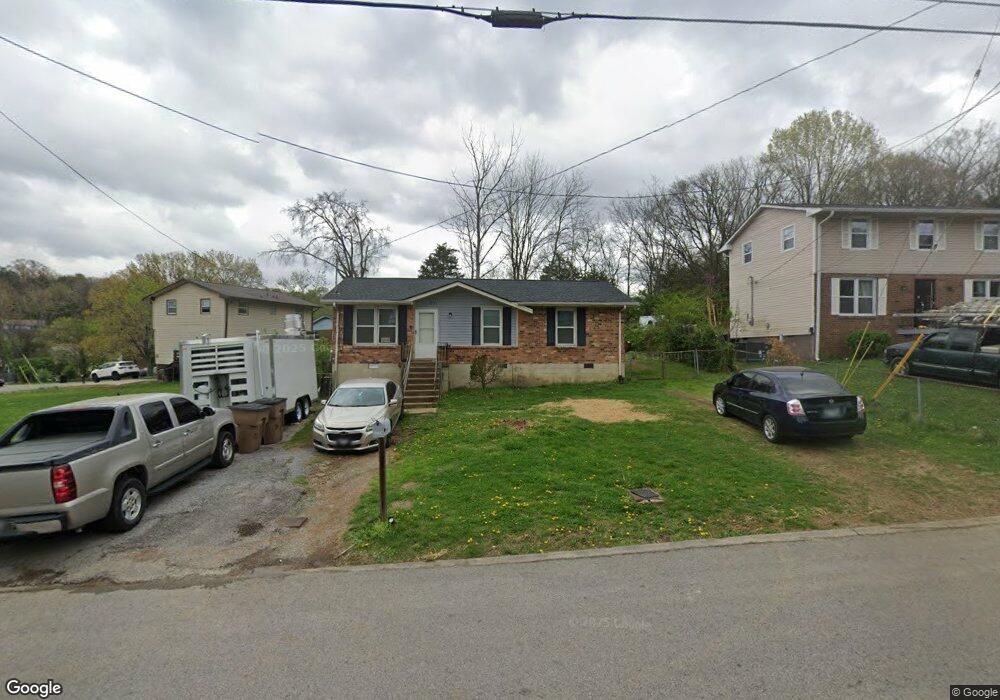
2776 Old Matthews Rd Nashville, TN 37207
Talbot's Corner NeighborhoodEstimated Value: $270,000 - $319,000
3
Beds
1
Bath
1,084
Sq Ft
$268/Sq Ft
Est. Value
About This Home
This home is located at 2776 Old Matthews Rd, Nashville, TN 37207 and is currently estimated at $290,821, approximately $268 per square foot. 2776 Old Matthews Rd is a home located in Davidson County with nearby schools including Alex Green Elementary School, Joelton Elementary School, and Haynes Middle.
Ownership History
Date
Name
Owned For
Owner Type
Purchase Details
Closed on
Feb 28, 2005
Sold by
Cook Barbara
Bought by
Cook Marvin
Current Estimated Value
Purchase Details
Closed on
Sep 20, 2004
Sold by
Cook Barbara
Bought by
Cook Marvin
Purchase Details
Closed on
Jan 17, 2002
Sold by
Driver Anthony M
Bought by
Washington Mutual Bank Fa
Purchase Details
Closed on
Jul 27, 1999
Sold by
Dillard Arlene A
Bought by
Driver Anthony M
Home Financials for this Owner
Home Financials are based on the most recent Mortgage that was taken out on this home.
Original Mortgage
$59,523
Interest Rate
7.66%
Mortgage Type
FHA
Purchase Details
Closed on
Nov 4, 1997
Sold by
Suttle Joe H
Bought by
Dillard Arlene A
Home Financials for this Owner
Home Financials are based on the most recent Mortgage that was taken out on this home.
Original Mortgage
$50,000
Interest Rate
7.31%
Create a Home Valuation Report for This Property
The Home Valuation Report is an in-depth analysis detailing your home's value as well as a comparison with similar homes in the area
Home Values in the Area
Average Home Value in this Area
Purchase History
| Date | Buyer | Sale Price | Title Company |
|---|---|---|---|
| Cook Marvin | -- | Infinity Title Llc | |
| Cook Marvin | -- | -- | |
| Washington Mutual Bank Fa | $62,586 | -- | |
| Driver Anthony M | $62,000 | -- | |
| Dillard Arlene A | $55,000 | -- | |
| Dillard Arlene A | $55,000 | Bicentennial Title & Escrow |
Source: Public Records
Mortgage History
| Date | Status | Borrower | Loan Amount |
|---|---|---|---|
| Previous Owner | Driver Anthony M | $59,523 | |
| Previous Owner | Dillard Arlene A | $50,000 | |
| Closed | Dillard Arlene A | $7,460 | |
| Closed | Driver Anthony M | $5,850 |
Source: Public Records
Tax History Compared to Growth
Tax History
| Year | Tax Paid | Tax Assessment Tax Assessment Total Assessment is a certain percentage of the fair market value that is determined by local assessors to be the total taxable value of land and additions on the property. | Land | Improvement |
|---|---|---|---|---|
| 2024 | $1,477 | $45,375 | $11,250 | $34,125 |
| 2023 | $1,477 | $45,375 | $11,250 | $34,125 |
| 2022 | $1,477 | $45,375 | $11,250 | $34,125 |
| 2021 | $1,492 | $45,375 | $11,250 | $34,125 |
| 2020 | $746 | $17,675 | $6,250 | $11,425 |
| 2019 | $558 | $17,675 | $6,250 | $11,425 |
| 2018 | $558 | $17,675 | $6,250 | $11,425 |
| 2017 | $558 | $17,675 | $6,250 | $11,425 |
| 2016 | $596 | $13,200 | $2,750 | $10,450 |
| 2015 | $596 | $13,200 | $2,750 | $10,450 |
| 2014 | $596 | $13,200 | $2,750 | $10,450 |
Source: Public Records
Map
Nearby Homes
- 2800 Old Matthews Rd
- 2701 Combs Dr
- 529 Combs Terrace
- 2629 Old Matthews Rd
- 2310 Ilolo St
- 131 Faraday Pass
- 2400 Old Matthews Rd
- 2327C Whites Creek Pike
- 2408 Woodale Ln
- 104 Highland Trace Cove
- 406 Matthews Ct
- 2202 Old Matthews Rd
- 609 Live Life Ln
- 522 Proximity Cir
- Bella Plan at Proximity
- Itasca Plan at Proximity
- Flora Plan at Proximity
- O'Hush Plan at Proximity
- Alton Plan at Proximity
- Keystone Plan at Proximity
- 2780 Old Matthews Rd
- 2774 Old Matthews Rd
- 2746 Combs Dr
- 2742 Combs Dr
- 2784 Old Matthews Rd
- 2738 Combs Dr
- 2777 Old Matthews Rd
- 500 Pappus Ct
- 2788 Old Matthews Rd
- 2781 Old Matthews Rd
- 2734 Combs Dr
- 504 Pappus Ct
- 2792 Old Matthews Rd
- 2770 Old Matthews Rd
- 2757 Combs Dr
- 2789 Old Matthews Rd
- 2730 Combs Dr
- 508 Pappus Ct
- 2753 Combs Dr
- 2796 Old Matthews Rd