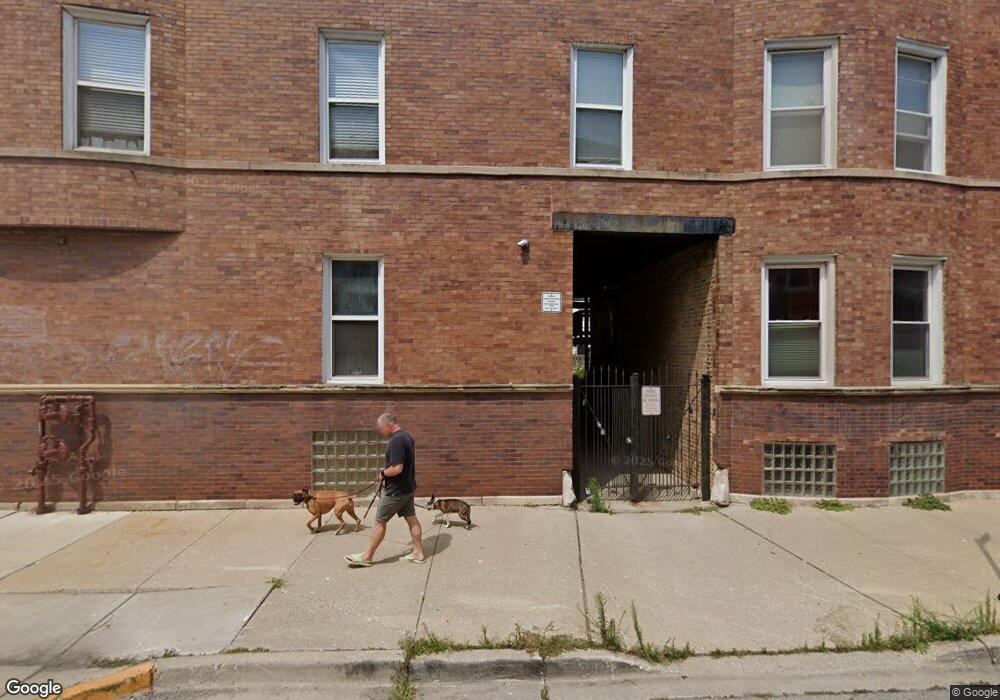
2778 W Francis Place Unit G2 Chicago, IL 60647
Logan Square NeighborhoodEstimated Value: $327,796 - $743,000
2
Beds
1
Bath
811
Sq Ft
$542/Sq Ft
Est. Value
About This Home
This home is located at 2778 W Francis Place Unit G2, Chicago, IL 60647 and is currently estimated at $439,699, approximately $542 per square foot. 2778 W Francis Place Unit G2 is a home located in Cook County with nearby schools including Chase Elementary School, Clemente Community Academy High School, and St. Sylvester School.
Ownership History
Date
Name
Owned For
Owner Type
Purchase Details
Closed on
Sep 22, 2021
Sold by
Depasquale Sara Chnstine and Engle Bryan
Bought by
Miller Mary
Current Estimated Value
Home Financials for this Owner
Home Financials are based on the most recent Mortgage that was taken out on this home.
Original Mortgage
$256,500
Outstanding Balance
$195,859
Interest Rate
2.12%
Mortgage Type
New Conventional
Estimated Equity
$243,840
Purchase Details
Closed on
Jun 15, 2018
Sold by
Beaman Kelley
Bought by
Depasquale Sara Christine
Home Financials for this Owner
Home Financials are based on the most recent Mortgage that was taken out on this home.
Original Mortgage
$251,230
Interest Rate
4.75%
Mortgage Type
New Conventional
Create a Home Valuation Report for This Property
The Home Valuation Report is an in-depth analysis detailing your home's value as well as a comparison with similar homes in the area
Home Values in the Area
Average Home Value in this Area
Purchase History
| Date | Buyer | Sale Price | Title Company |
|---|---|---|---|
| Miller Mary | $285,000 | Old Republic Title | |
| Depasquale Sara Christine | $259,000 | None Available |
Source: Public Records
Mortgage History
| Date | Status | Borrower | Loan Amount |
|---|---|---|---|
| Open | Miller Mary | $256,500 | |
| Previous Owner | Depasquale Sara Christine | $251,230 |
Source: Public Records
Tax History Compared to Growth
Tax History
| Year | Tax Paid | Tax Assessment Tax Assessment Total Assessment is a certain percentage of the fair market value that is determined by local assessors to be the total taxable value of land and additions on the property. | Land | Improvement |
|---|---|---|---|---|
| 2024 | $4,644 | $25,100 | $2,385 | $22,715 |
| 2023 | $4,527 | $21,934 | $1,086 | $20,848 |
| 2022 | $4,527 | $21,934 | $1,086 | $20,848 |
| 2021 | $3,753 | $21,933 | $1,086 | $20,847 |
| 2020 | $3,321 | $17,955 | $1,086 | $16,869 |
| 2019 | $3,313 | $19,858 | $1,086 | $18,772 |
| 2018 | $3,244 | $19,858 | $1,086 | $18,772 |
| 2017 | $2,691 | $15,876 | $958 | $14,918 |
| 2016 | $2,680 | $15,876 | $958 | $14,918 |
| 2015 | $2,429 | $15,876 | $958 | $14,918 |
| 2014 | $1,730 | $11,890 | $862 | $11,028 |
| 2013 | $1,684 | $11,890 | $862 | $11,028 |
Source: Public Records
Map
Nearby Homes
- 2771 W Francis Place Unit 305N
- 1935 N Fairfield Ave Unit 112
- 1934 N Washtenaw Ave Unit 103
- 2720 W Cortland St Unit P33
- 1925 N Francisco Ave
- 2706 W Cortland St Unit 3
- 2118 N Bingham St
- 2628 W Homer St
- 2139 N Bingham St
- 2704 W Cortland St Unit 3
- 2161 N California Ave Unit 105
- 2056 N Bingham St
- 1841 N California Ave Unit 3B
- 2758 N Mozart St
- 2147 N Bingham St
- 1925 N Humboldt Blvd Unit P14
- 2168 N Rockwell St
- 2015 N Bingham St
- 2820 W Lyndale St Unit 2
- 2009 N Bingham St
- 2778 W Francis Place Unit 2
- 2778 W Francis Place Unit G1
- 2778 W Francis Place Unit G3
- 2778 W Francis Place Unit 2G
- 2778 W Francis Place Unit 3
- 2778 W Francis Place Unit 1
- 2774 W Francis Place
- 2758 W Francis Place Unit 203
- 2758 W Francis Place Unit 204
- 2758 W Francis Place Unit 101
- 2758 W Francis Place Unit 202
- 2758 W Francis Place Unit 301
- 2758 W Francis Place Unit 302
- 2758 W Francis Place Unit 303
- 2758 W Francis Place Unit 104
- 2758 W Francis Place Unit 201
- 2758 W Francis Place Unit 103
- 2758 W Francis Place Unit 102
- 2758 W Francis Place Unit 304
- 2754 W Francis Place