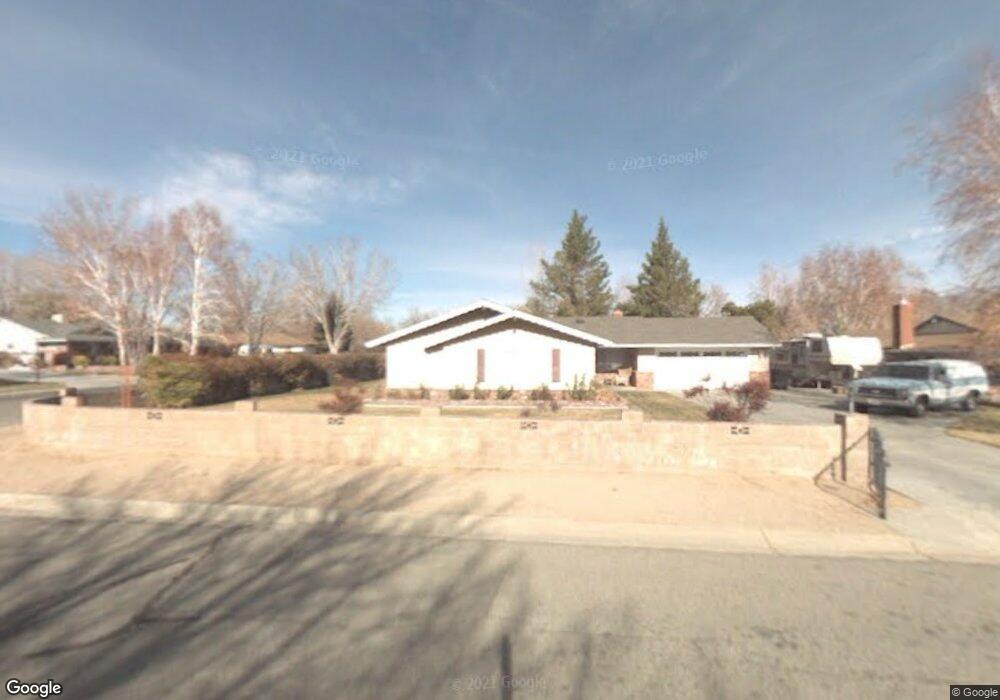
2779 Glenbrook Way Bishop, CA 93514
Estimated Value: $611,282 - $696,000
3
Beds
2
Baths
1,711
Sq Ft
$379/Sq Ft
Est. Value
About This Home
This home is located at 2779 Glenbrook Way, Bishop, CA 93514 and is currently estimated at $649,071, approximately $379 per square foot. 2779 Glenbrook Way is a home located in Inyo County with nearby schools including Bishop Elementary School, Elm Street Elementary School, and Home Street Middle School.
Ownership History
Date
Name
Owned For
Owner Type
Purchase Details
Closed on
Feb 16, 2012
Sold by
Grey Richard K and Grey Marianne
Bought by
Dossey Mark and Dossey Michele
Current Estimated Value
Home Financials for this Owner
Home Financials are based on the most recent Mortgage that was taken out on this home.
Original Mortgage
$267,600
Outstanding Balance
$32,347
Interest Rate
3.84%
Mortgage Type
New Conventional
Estimated Equity
$616,724
Purchase Details
Closed on
Jun 15, 2009
Sold by
Grey Richard K and Grey Marianne
Bought by
Grey Richard K and Grey Marianne
Home Financials for this Owner
Home Financials are based on the most recent Mortgage that was taken out on this home.
Original Mortgage
$290,100
Interest Rate
4.83%
Mortgage Type
New Conventional
Purchase Details
Closed on
Sep 28, 2005
Sold by
Grey Richard K and Grey Marianne
Bought by
Grey Richard K and Grey Marianne
Create a Home Valuation Report for This Property
The Home Valuation Report is an in-depth analysis detailing your home's value as well as a comparison with similar homes in the area
Home Values in the Area
Average Home Value in this Area
Purchase History
| Date | Buyer | Sale Price | Title Company |
|---|---|---|---|
| Dossey Mark | $334,500 | Inyo Mono Title Company | |
| Grey Richard K | -- | None Available | |
| Grey Richard K | -- | Lsi | |
| Grey Richard K | -- | -- |
Source: Public Records
Mortgage History
| Date | Status | Borrower | Loan Amount |
|---|---|---|---|
| Open | Dossey Mark | $267,600 | |
| Previous Owner | Grey Richard K | $290,100 |
Source: Public Records
Tax History Compared to Growth
Tax History
| Year | Tax Paid | Tax Assessment Tax Assessment Total Assessment is a certain percentage of the fair market value that is determined by local assessors to be the total taxable value of land and additions on the property. | Land | Improvement |
|---|---|---|---|---|
| 2025 | $4,315 | $420,137 | $188,401 | $231,736 |
| 2024 | $4,315 | $411,900 | $184,707 | $227,193 |
| 2023 | $4,217 | $403,825 | $181,086 | $222,739 |
| 2022 | $4,199 | $395,908 | $177,536 | $218,372 |
| 2021 | $4,130 | $388,146 | $174,055 | $214,091 |
| 2020 | $3,993 | $384,167 | $172,271 | $211,896 |
| 2019 | $3,993 | $376,636 | $168,894 | $207,742 |
| 2018 | $3,906 | $369,252 | $165,583 | $203,669 |
| 2017 | $3,826 | $362,013 | $162,337 | $199,676 |
| 2016 | $3,782 | $354,915 | $159,154 | $195,761 |
| 2015 | $3,708 | $349,585 | $156,764 | $192,821 |
| 2014 | $3,633 | $342,738 | $153,694 | $189,044 |
Source: Public Records
Map
Nearby Homes
- 2693 Glenbrook Way
- 807 S Barlow Ln
- 807 S Barlow Ln Unit 34
- 85 Schober Ln Unit 17
- 223 Wildrose Ln
- 3115 W Line St
- 3115 W Line St Unit 1
- 324 Mclaren Ln Unit 12
- 1369 Glenwood Ln
- 1369 Glenwood Ln Unit 48
- 896 Home St
- 1424 Rocking West Dr
- 2371 Edinburgh Ave
- 543 Sierra St
- 2322 Galloway Ave
- 2310 Fiora Ave
- 771 N Main St Unit 39
- 1510 Glenwood Ln Unit 47
- 1495 Argyle Ln
- 1495 Argyle Ln Unit 86
- 2773 Glenbrook Way
- 700 Orinda Dr Unit 8
- 700 Orinda Dr
- 2767 Glenbrook Way
- 2774 Sierra Vista Way Unit 9
- 2774 Sierra Vista Way
- 711 Orinda Dr
- 2782 Glenbrook Way
- 735 Orinda Dr
- 2776 Glenbrook Way
- 2768 Sierra Vista Way
- 2761 Glenbrook Way
- 747 Orinda Dr
- 2770 Glenbrook Way
- 2762 Sierra Vista Way
- 2775 Underwood Ln
- 2764 Glenbrook Way Unit 31
- 2764 Glenbrook Way
- 2755 Glenbrook Way
- 759 Orinda Dr