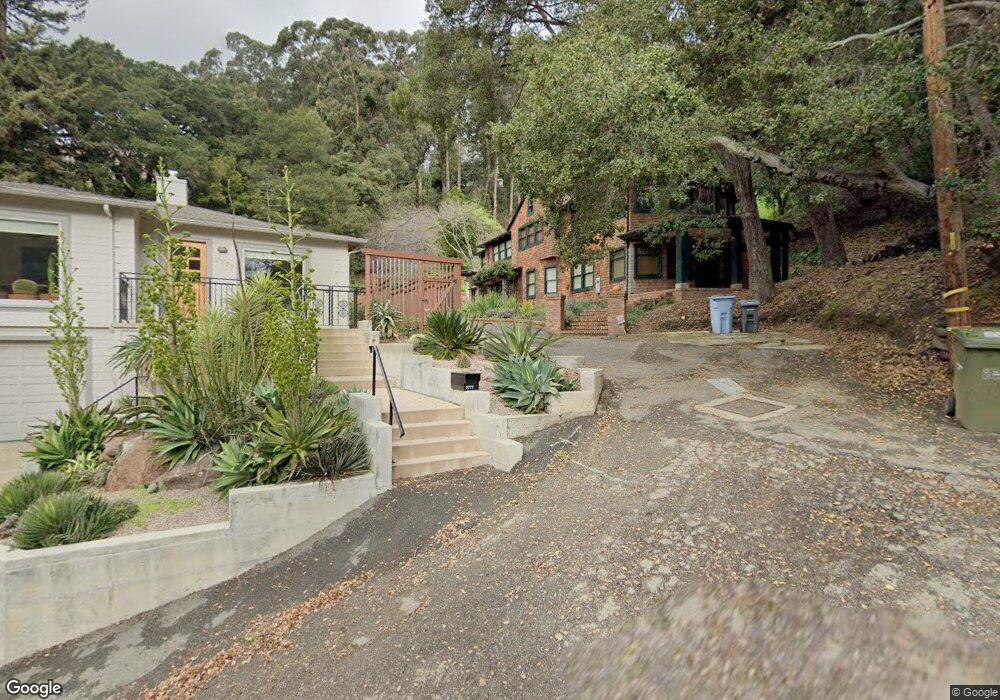
2779 Hilgard Ave Berkeley, CA 94709
Estimated Value: $1,108,000 - $3,517,000
4
Beds
3
Baths
3,916
Sq Ft
$591/Sq Ft
Est. Value
About This Home
This home is located at 2779 Hilgard Ave, Berkeley, CA 94709 and is currently estimated at $2,312,500, approximately $590 per square foot. 2779 Hilgard Ave is a home located in Alameda County with nearby schools including Berkeley Arts Magnet at Whittier School, Washington Elementary School, and Cragmont Elementary School.
Ownership History
Date
Name
Owned For
Owner Type
Purchase Details
Closed on
Sep 27, 2017
Sold by
Destabelle Michael H and Steele Jennifer L
Bought by
Zhang Haipeng
Current Estimated Value
Purchase Details
Closed on
Jan 7, 1997
Sold by
Hansen Bertha J
Bought by
Harder James A
Purchase Details
Closed on
Apr 3, 1995
Sold by
Destabelle Michael H
Bought by
Destabelle Michael H and Steele Jennifer L
Home Financials for this Owner
Home Financials are based on the most recent Mortgage that was taken out on this home.
Original Mortgage
$500,000
Interest Rate
8.81%
Purchase Details
Closed on
Aug 27, 1990
Sold by
Va
Bought by
Harder James A and Harder Bertha J
Create a Home Valuation Report for This Property
The Home Valuation Report is an in-depth analysis detailing your home's value as well as a comparison with similar homes in the area
Purchase History
| Date | Buyer | Sale Price | Title Company |
|---|---|---|---|
| Zhang Haipeng | $2,500,000 | Chicago Title Company | |
| Harder James A | -- | -- | |
| Destabelle Michael H | -- | Old Republic Title Company | |
| Harder James A | -- | -- |
Source: Public Records
Mortgage History
| Date | Status | Borrower | Loan Amount |
|---|---|---|---|
| Previous Owner | Destabelle Michael H | $500,000 |
Source: Public Records
Tax History
| Year | Tax Paid | Tax Assessment Tax Assessment Total Assessment is a certain percentage of the fair market value that is determined by local assessors to be the total taxable value of land and additions on the property. | Land | Improvement |
|---|---|---|---|---|
| 2025 | $6,895 | $475,603 | $473,328 | $2,275 |
| 2024 | $6,895 | $466,279 | $464,048 | $2,231 |
| 2023 | $6,750 | $457,137 | $454,950 | $2,187 |
| 2022 | $6,643 | $448,175 | $446,031 | $2,144 |
| 2021 | $6,669 | $439,388 | $437,286 | $2,102 |
| 2020 | $6,341 | $434,886 | $432,806 | $2,080 |
| 2019 | $6,114 | $426,360 | $424,320 | $2,040 |
| 2018 | $6,183 | $418,000 | $416,000 | $2,000 |
| 2017 | $2,354 | $110,724 | $98,118 | $12,606 |
| 2016 | $2,232 | $108,554 | $96,195 | $12,359 |
| 2015 | $2,372 | $179,438 | $94,750 | $84,688 |
| 2014 | $3,177 | $175,923 | $92,894 | $83,029 |
Source: Public Records
Map
Nearby Homes
- 2700 Le Conte Ave Unit 301
- 2700 Le Conte Ave Unit 402
- 2600 Hilgard Ave
- 2634 Virginia St Unit 13
- 2451 Le Conte Ave
- 1375 Queens Rd
- 209 Fairlawn Dr
- 0 Queens Rd Unit ML82024219
- 1471 Scenic Ave
- 1468 Summit Rd
- 2340 Virginia St
- 120 Hill Rd
- 2201 Virginia St Unit 2
- 1165 Cragmont Ave
- 1136 Keith Ave
- 1444 Walnut St
- 1110 Sterling Ave
- 1440 Walnut St Unit 5
- 0 Panoramic Way Unit 41118724
- 1106 Cragmont Ave
- 2779 Hilgard Ave
- 2777 Hilgard Ave
- 2775 Hilgard Ave
- 2798 Buena Vista Way
- 2735 Hilgard Ave
- 2750 Cedar St
- 2808 Hilgard Ave
- 2725 Hilgard Ave
- 1601 La Vereda Rd
- 2776 Hilgard Ave
- 2776 Hilgard Ave
- 1611 La Vereda Rd
- 1615 La Vereda Rd
- 3090 Buena Vista Way
- 2772 Hilgard Ave
- 2804 Buena Vista Way
- 1595 La Vereda Rd
- 1629 La Vereda Rd
- 2800 Buena Vista Way
- 1631 La Vereda Rd
Your Personal Tour Guide
Ask me questions while you tour the home.