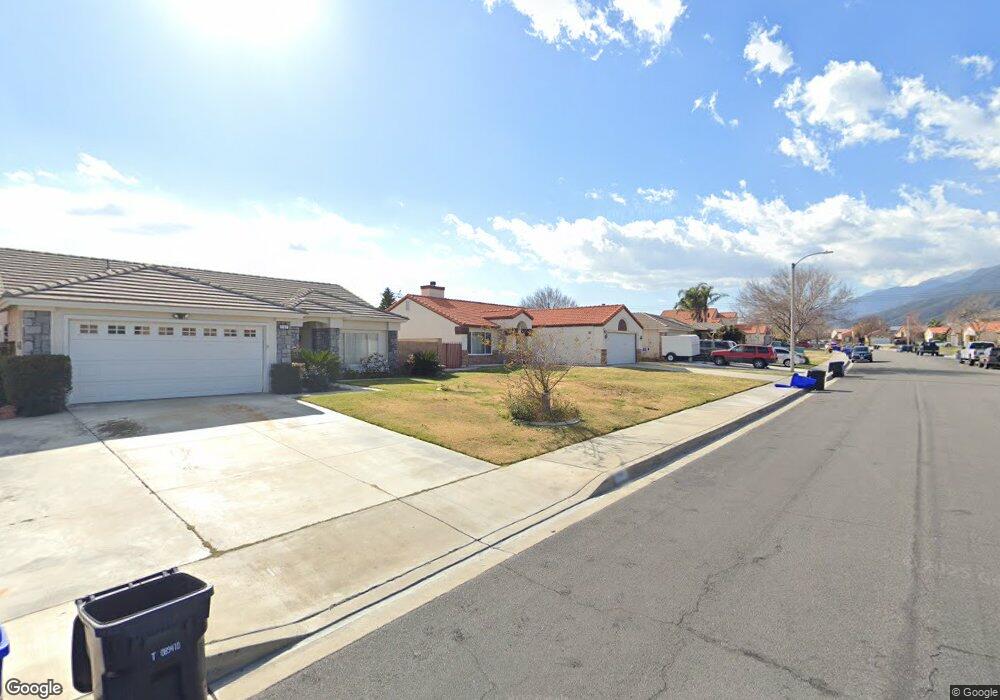
2779 W Esperanza Dr Rialto, CA 92377
Estimated Value: $576,706 - $650,000
2
Beds
2
Baths
1,253
Sq Ft
$489/Sq Ft
Est. Value
About This Home
This home is located at 2779 W Esperanza Dr, Rialto, CA 92377 and is currently estimated at $612,677, approximately $488 per square foot. 2779 W Esperanza Dr is a home located in San Bernardino County with nearby schools including Nancy R. Kordyak Elementary School, Ethel Kucera Middle School, and Wilmer Amina Carter High School.
Ownership History
Date
Name
Owned For
Owner Type
Purchase Details
Closed on
Apr 23, 2012
Sold by
Perez Lanita
Bought by
Navarro Helio E and Navarro Diana D
Current Estimated Value
Home Financials for this Owner
Home Financials are based on the most recent Mortgage that was taken out on this home.
Original Mortgage
$196,377
Outstanding Balance
$134,611
Interest Rate
3.75%
Mortgage Type
FHA
Estimated Equity
$478,066
Purchase Details
Closed on
Jun 2, 2011
Sold by
Perez Joel V
Bought by
Perez Lanita
Purchase Details
Closed on
Nov 4, 1998
Sold by
Nelson Dane and Nelson Brigitte
Bought by
Gilliam Birther Lee
Home Financials for this Owner
Home Financials are based on the most recent Mortgage that was taken out on this home.
Original Mortgage
$52,000
Interest Rate
6.86%
Purchase Details
Closed on
Mar 1, 1994
Sold by
Graciolett Mildred Brigitte
Bought by
Nelson Dane and Nelson Brigitte
Create a Home Valuation Report for This Property
The Home Valuation Report is an in-depth analysis detailing your home's value as well as a comparison with similar homes in the area
Home Values in the Area
Average Home Value in this Area
Purchase History
| Date | Buyer | Sale Price | Title Company |
|---|---|---|---|
| Navarro Helio E | $195,000 | Lawyers Title | |
| Perez Lanita | -- | None Available | |
| Perez Lanita | -- | None Available | |
| Gilliam Birther Lee | $112,000 | Orange Coast Title | |
| Nelson Dane | -- | -- |
Source: Public Records
Mortgage History
| Date | Status | Borrower | Loan Amount |
|---|---|---|---|
| Open | Navarro Helio E | $196,377 | |
| Previous Owner | Gilliam Birther Lee | $52,000 |
Source: Public Records
Tax History Compared to Growth
Tax History
| Year | Tax Paid | Tax Assessment Tax Assessment Total Assessment is a certain percentage of the fair market value that is determined by local assessors to be the total taxable value of land and additions on the property. | Land | Improvement |
|---|---|---|---|---|
| 2025 | $3,325 | $244,929 | $62,803 | $182,126 |
| 2024 | $3,325 | $240,127 | $61,572 | $178,555 |
| 2023 | $3,514 | $235,419 | $60,365 | $175,054 |
| 2022 | $3,257 | $230,803 | $59,181 | $171,622 |
| 2021 | $3,237 | $226,278 | $58,021 | $168,257 |
| 2020 | $3,245 | $223,958 | $57,426 | $166,532 |
| 2019 | $3,178 | $219,567 | $56,300 | $163,267 |
| 2018 | $3,074 | $215,262 | $55,196 | $160,066 |
| 2017 | $2,982 | $211,041 | $54,114 | $156,927 |
| 2016 | $2,789 | $206,903 | $53,053 | $153,850 |
| 2015 | $2,903 | $203,795 | $52,256 | $151,539 |
| 2014 | $2,772 | $199,803 | $51,232 | $148,571 |
Source: Public Records
Map
Nearby Homes
- 4788 Condor Ave
- 17026 Schneider St
- 2768 W Buena Vista Dr
- 2540 W Via Bello Dr
- 17012 Hal Ln
- 16708 Yarrow Ln
- 2516 Yellowstone Way
- 16707 Island Oak St
- Plan 3 at The Arboretum - Trellis
- Plan 2 at The Arboretum - Trellis
- Plan 1 at The Arboretum - Trellis
- Plan 3 at The Arboretum - Marigold
- Plan 2 at The Arboretum - Marigold
- Plan 1 at The Arboretum - Marigold
- 16583 Bottlebrush Ln
- 16583 Bottlebrush Ln Unit 1
- 16573 Bottlebrush Ln
- 16573 Bottlebrush Ln Unit 3
- 16612 Botanical Ln
- 16560 Stone Pine Ln
- 2779 W Esperanza Dr
- 2791 W Esperanza Dr
- 2767 W Esperanza Dr
- 2808 Plaza Serena Dr
- 2794 Plaza Serena Dr
- 2809 W Esperanza Dr
- 2755 W Esperanza Dr
- 2755 W Esperanza Dr
- 2820 Plaza Serena Dr
- 2786 Plaza Serena Dr
- 2782 W Esperanza Dr
- 2772 W Esperanza Dr
- 2782 W Esperanza Dr
- 2772 W Esperanza Dr
- 2832 Plaza Serena Dr
- 2819 W Esperanza Dr
- 2792 W Esperanza Dr
- 2762 W Esperanza Dr
- 2762 W Esperanza Dr
- 2810 W Esperanza Dr