278 & 280 Barnes Ln Columbia Falls, MT 59912
Estimated Value: $1,113,000 - $2,479,000
5
Beds
4
Baths
5,345
Sq Ft
$333/Sq Ft
Est. Value
About This Home
This home is located at 278 & 280 Barnes Ln, Columbia Falls, MT 59912 and is currently estimated at $1,782,241, approximately $333 per square foot. 278 & 280 Barnes Ln is a home located in Flathead County with nearby schools including L.A. Muldown School, Whitefish Middle School, and Whitefish High School.
Ownership History
Date
Name
Owned For
Owner Type
Purchase Details
Closed on
Oct 3, 2022
Sold by
Anglin David
Bought by
Halleck Jeffrey and Halleck Alexandra
Current Estimated Value
Home Financials for this Owner
Home Financials are based on the most recent Mortgage that was taken out on this home.
Original Mortgage
$1,200,000
Outstanding Balance
$1,138,512
Interest Rate
4.25%
Mortgage Type
New Conventional
Estimated Equity
$643,729
Purchase Details
Closed on
Feb 7, 2017
Sold by
Mcgunagle Tim
Bought by
Forthofer Joseph P and Forthofer Deborah E
Purchase Details
Closed on
Jul 23, 2011
Sold by
Mcgunagle Glenda
Bought by
Mcgunagle Tim
Create a Home Valuation Report for This Property
The Home Valuation Report is an in-depth analysis detailing your home's value as well as a comparison with similar homes in the area
Home Values in the Area
Average Home Value in this Area
Purchase History
| Date | Buyer | Sale Price | Title Company |
|---|---|---|---|
| Halleck Jeffrey | -- | Fidelity National Title | |
| Forthofer Joseph P | -- | Insured Titles | |
| Mcgunagle Tim | -- | None Available |
Source: Public Records
Mortgage History
| Date | Status | Borrower | Loan Amount |
|---|---|---|---|
| Open | Halleck Jeffrey | $1,200,000 |
Source: Public Records
Tax History Compared to Growth
Tax History
| Year | Tax Paid | Tax Assessment Tax Assessment Total Assessment is a certain percentage of the fair market value that is determined by local assessors to be the total taxable value of land and additions on the property. | Land | Improvement |
|---|---|---|---|---|
| 2025 | $7,423 | $1,797,700 | $0 | $0 |
| 2024 | $6,293 | $1,372,562 | $0 | $0 |
| 2023 | $6,407 | $1,372,562 | $0 | $0 |
| 2022 | $5,676 | $857,200 | $0 | $0 |
| 2021 | $5,738 | $857,200 | $0 | $0 |
| 2020 | $5,526 | $785,100 | $0 | $0 |
| 2019 | $4,628 | $604,059 | $0 | $0 |
| 2018 | $4,938 | $633,700 | $0 | $0 |
| 2017 | $4,350 | $595,500 | $0 | $0 |
| 2016 | $3,709 | $496,058 | $0 | $0 |
| 2015 | $3,656 | $496,058 | $0 | $0 |
| 2014 | $3,940 | $325,749 | $0 | $0 |
Source: Public Records
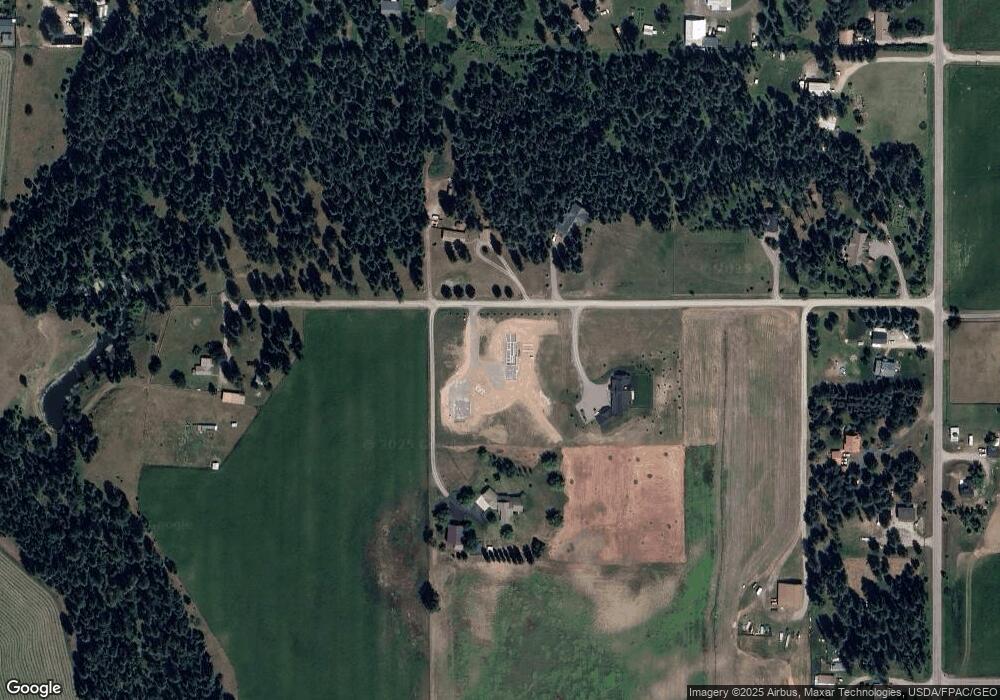
Map
Nearby Homes
- Nhn Conagher Ln
- 229 Sandy Hill Ln
- 1995 Conn Rd
- 15 Sandy Hill Terrace
- 208 Cowboy Dr
- 52 Haps Ln
- 211 Cowboy Dr
- 405 Sandy Hill Ln
- 400 Sandy Hill Ln
- 205 Kinnikinnick Ln
- 4336 Mt Highway 40 W
- 35 Stagecoach Dr
- 37 Hodgson Rd
- 4480 Mt Highway 40 W
- 200 Stageline Dr
- 56 Wagon Wheel Rd
- 6205 Davos Ln Unit B
- 360 Plantation Dr
- 6203 Monterra Ave Unit H
- 125 Wagon Wheel Rd