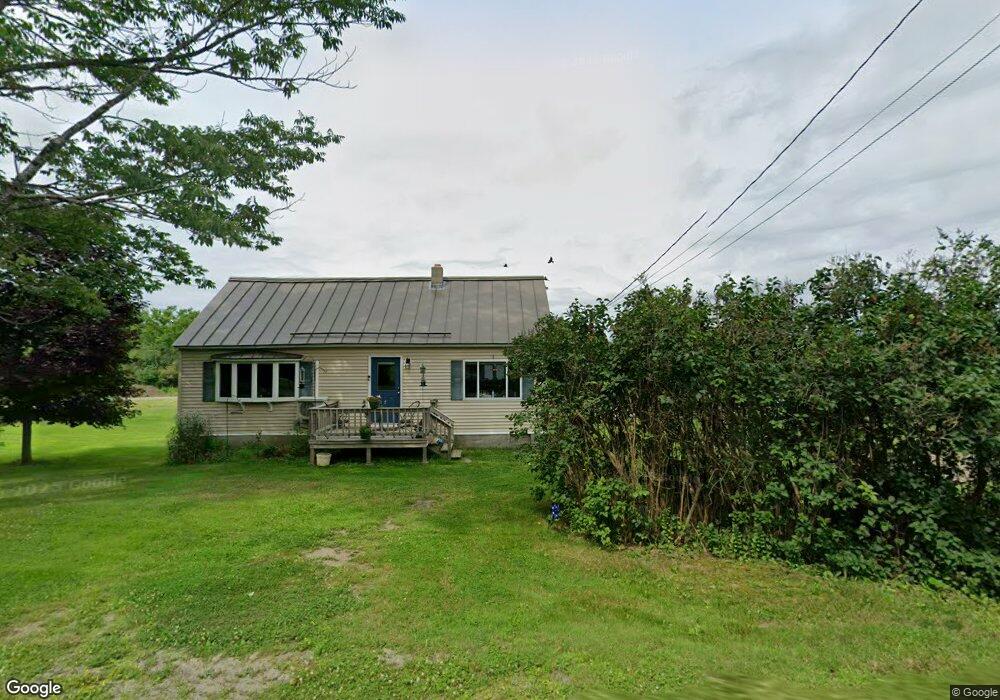
278 Abbott Rd Winslow, ME 04901
Estimated Value: $251,000 - $334,000
2
Beds
1
Bath
1,239
Sq Ft
$237/Sq Ft
Est. Value
About This Home
This home is located at 278 Abbott Rd, Winslow, ME 04901 and is currently estimated at $293,596, approximately $236 per square foot. 278 Abbott Rd is a home located in Kennebec County with nearby schools including Winslow Elementary School, Winslow Junior High School, and Winslow High School.
Ownership History
Date
Name
Owned For
Owner Type
Purchase Details
Closed on
Dec 29, 2025
Sold by
Folsom Derek
Bought by
Folsom Properties Llc
Current Estimated Value
Purchase Details
Closed on
Mar 31, 2025
Sold by
Quimby Ft and Mcdonald
Bought by
Folsom Venessa
Home Financials for this Owner
Home Financials are based on the most recent Mortgage that was taken out on this home.
Original Mortgage
$40,800
Interest Rate
6.87%
Mortgage Type
New Conventional
Purchase Details
Closed on
Feb 14, 2025
Sold by
Quimby Ft and Mcdonald
Bought by
Folsom Derek and Folsom Jessica
Home Financials for this Owner
Home Financials are based on the most recent Mortgage that was taken out on this home.
Original Mortgage
$40,800
Interest Rate
6.87%
Mortgage Type
New Conventional
Purchase Details
Closed on
Nov 21, 2014
Sold by
Quimby Lillian
Bought by
Penney Adam
Create a Home Valuation Report for This Property
The Home Valuation Report is an in-depth analysis detailing your home's value as well as a comparison with similar homes in the area
Home Values in the Area
Average Home Value in this Area
Purchase History
We collect this data history from publicly available records. To have your information removed, we recommend requesting removal directly through your county’s website.
| Date | Buyer | Sale Price | Title Company |
|---|---|---|---|
| Folsom Properties Llc | -- | -- | |
| Folsom Derek | -- | -- | |
| Folsom Venessa | $51,000 | None Available | |
| Folsom Venessa | $51,000 | None Available | |
| Folsom Venessa | $51,000 | None Available | |
| Folsom Derek | $270,000 | None Available | |
| Folsom Derek | $270,000 | None Available | |
| Folsom Derek | $270,000 | None Available | |
| Penney Adam | -- | -- | |
| Quimby Ft | -- | -- | |
| Penney Adam R | -- | -- | |
| Penney Adam R | -- | -- | |
| Quimby Ft | -- | -- |
Source: Public Records
Mortgage History
We collect this data history from publicly available records. To have your information removed, we recommend requesting removal directly through your county’s website.
| Date | Status | Borrower | Loan Amount |
|---|---|---|---|
| Previous Owner | Folsom Venessa | $40,800 |
Source: Public Records
Tax History
| Year | Tax Paid | Tax Assessment Tax Assessment Total Assessment is a certain percentage of the fair market value that is determined by local assessors to be the total taxable value of land and additions on the property. | Land | Improvement |
|---|---|---|---|---|
| 2024 | $3,957 | $263,800 | $98,300 | $165,500 |
| 2023 | $3,957 | $263,800 | $98,300 | $165,500 |
| 2022 | $3,326 | $156,900 | $69,400 | $87,500 |
| 2021 | $3,169 | $156,900 | $69,400 | $87,500 |
| 2020 | $2,953 | $156,900 | $69,400 | $87,500 |
| 2019 | $2,925 | $156,900 | $69,400 | $87,500 |
| 2018 | $2,815 | $156,900 | $69,400 | $87,500 |
| 2017 | $2,256 | $156,900 | $69,400 | $87,500 |
| 2016 | $2,470 | $156,900 | $69,400 | $87,500 |
| 2015 | $2,585 | $166,800 | $79,300 | $87,500 |
| 2014 | $2,761 | $178,100 | $90,600 | $87,500 |
Source: Public Records
Map
Nearby Homes
- 142 Abbott Rd
- 498 Morrill Rd
- 210 Pond Rd
- Lot #58 S Vigue Shore Rd
- 1 N Vigue Shore Rd
- 21 N Vigue Shore Rd
- 51 N Vigue Shore Rd
- 0 China Rd
- 118 Marden Shore Rd
- 174 Pleasant View Ridge Rd
- 184 Pleasant View Ridge Rd
- 31 Neck Rd
- 100 N Pond Rd
- 1391 Albion Rd
- 35 Parmenter Terrace
- Lot 36 Albion Rd
- 257 Pleasant View Ridge Rd
- 41 White Fish Rd
- 40 White Fish Rd
- 1210 Lakeview Dr Unit 2
Your Personal Tour Guide
Ask me questions while you tour the home.