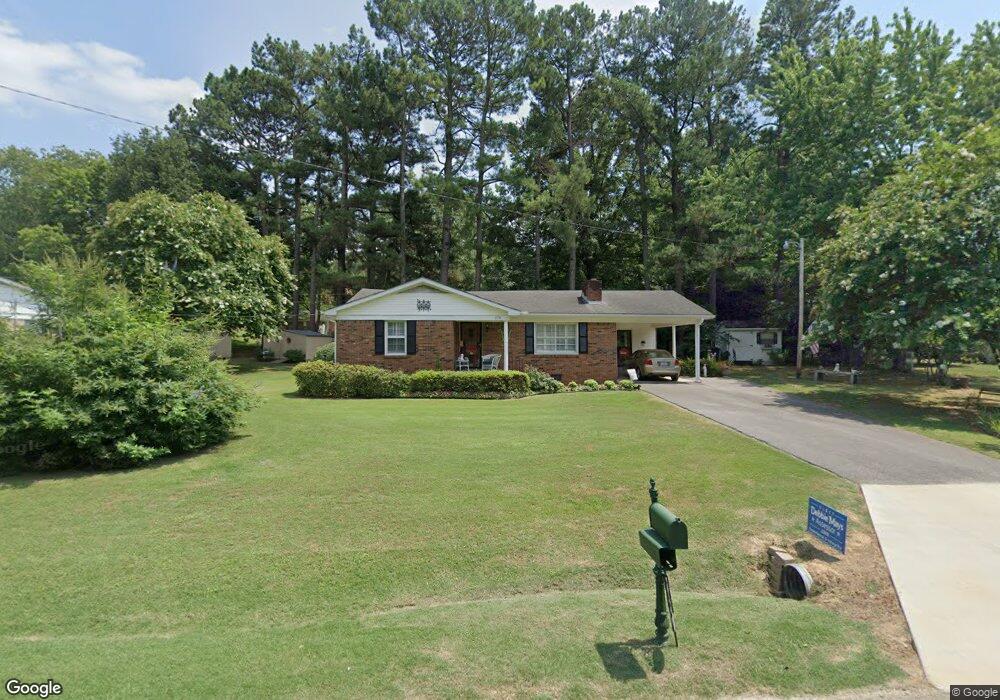
278 Anthony St Ripley, TN 38063
Estimated Value: $120,163 - $161,000
--
Bed
1
Bath
1,143
Sq Ft
$123/Sq Ft
Est. Value
About This Home
This home is located at 278 Anthony St, Ripley, TN 38063 and is currently estimated at $140,041, approximately $122 per square foot. 278 Anthony St is a home located in Lauderdale County with nearby schools including Ripley Primary School, Ripley Elementary School, and Ripley Middle School.
Ownership History
Date
Name
Owned For
Owner Type
Purchase Details
Closed on
Feb 20, 2009
Sold by
Hendrix Rebecca W
Bought by
Hendrix Rebecca W
Current Estimated Value
Purchase Details
Closed on
Jul 1, 2005
Sold by
Woodard Dorothy S
Bought by
Hendrix Rebecca W
Purchase Details
Closed on
Nov 6, 1998
Sold by
Pearl Ball
Bought by
Woodard Dorothy S
Purchase Details
Closed on
Oct 29, 1998
Sold by
Juanita Potter
Bought by
Pearl Ball
Purchase Details
Closed on
Oct 7, 1986
Bought by
Potter Juanita
Purchase Details
Closed on
Aug 30, 1977
Create a Home Valuation Report for This Property
The Home Valuation Report is an in-depth analysis detailing your home's value as well as a comparison with similar homes in the area
Home Values in the Area
Average Home Value in this Area
Purchase History
| Date | Buyer | Sale Price | Title Company |
|---|---|---|---|
| Hendrix Rebecca W | -- | -- | |
| Hendrix Rebecca W | $59,400 | -- | |
| Woodard Dorothy S | $55,000 | -- | |
| Pearl Ball | $55,000 | -- | |
| Potter Juanita | -- | -- | |
| -- | -- | -- |
Source: Public Records
Tax History Compared to Growth
Tax History
| Year | Tax Paid | Tax Assessment Tax Assessment Total Assessment is a certain percentage of the fair market value that is determined by local assessors to be the total taxable value of land and additions on the property. | Land | Improvement |
|---|---|---|---|---|
| 2025 | $562 | $22,150 | $0 | $0 |
| 2024 | $562 | $22,150 | $2,400 | $19,750 |
| 2023 | $1,117 | $22,150 | $2,400 | $19,750 |
| 2022 | $1,117 | $22,150 | $2,400 | $19,750 |
| 2021 | $1,069 | $22,150 | $2,400 | $19,750 |
| 2020 | $829 | $22,150 | $2,400 | $19,750 |
| 2019 | $829 | $15,075 | $3,000 | $12,075 |
| 2018 | $829 | $15,075 | $3,000 | $12,075 |
| 2017 | $810 | $15,075 | $3,000 | $12,075 |
| 2016 | $778 | $15,075 | $3,000 | $12,075 |
| 2015 | $764 | $15,075 | $3,000 | $12,075 |
| 2014 | $453 | $15,625 | $3,000 | $12,625 |
Source: Public Records
Map
Nearby Homes
- 115 Westwood Cove
- 103 April Cove
- 242 Lackey Ln
- 122 Willow Creek Dr
- 00 Willow Creek Dr
- 0 Kirkpatrick Dr
- 150 Westwood Cir
- 289 S Washington St
- 224 Kellar Ave
- 334 S Washington St
- 32 U S 51
- 33 U S 51
- 141 Tucker Ave
- 0 Cleveland St
- 0 Monroe St
- LOT 3 U S Highway 51
- LOT 2 U S Highway 51
- 303 Courtney Dr
- 0 Lake Dr Unit 242610
- 215 S Jefferson St
- 276 Anthony St
- 267 Thompson Ave
- 129 Thompson Dr
- 274 Anthony St
- 265 Thompson Dr
- 119 Thompson Dr
- 272 Anthony St
- 128 Thompson Dr
- 261 Thompson Ave
- 130 Thompson Dr
- 263 Anthony St
- 276 Thompson Ave
- 272 Thompson Ave
- 270 Anthony St
- 280 Thompson Ave
- 259 Thompson Ave
- 268 Thompson Ave
- 118 Thompson Dr
- 115 Thompson Dr
- 144 Thompson Dr