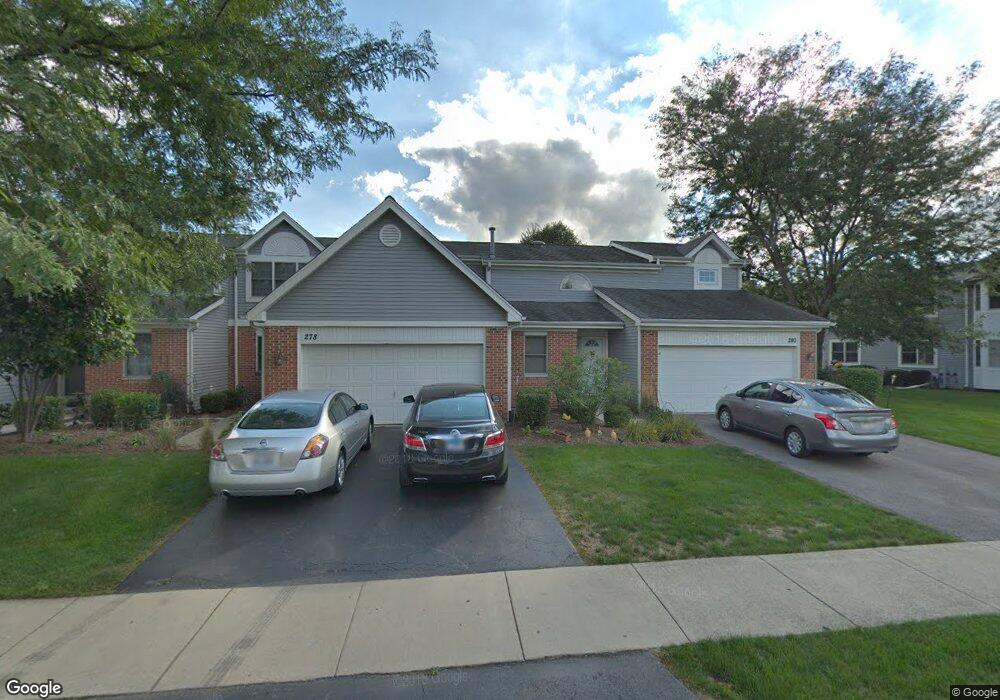
278 Eclipse Dr Unit 316 Carol Stream, IL 60188
Estimated Value: $315,000 - $324,000
3
Beds
3
Baths
1,500
Sq Ft
$212/Sq Ft
Est. Value
About This Home
This home is located at 278 Eclipse Dr Unit 316, Carol Stream, IL 60188 and is currently estimated at $318,198, approximately $212 per square foot. 278 Eclipse Dr Unit 316 is a home located in DuPage County with nearby schools including Western Trails Elementary School, Jay Stream Middle School, and Glenbard North High School.
Ownership History
Date
Name
Owned For
Owner Type
Purchase Details
Closed on
May 9, 2023
Sold by
Nudd William
Bought by
Thompson Emily M
Current Estimated Value
Purchase Details
Closed on
Aug 16, 2006
Sold by
Hartl Nicholas J
Bought by
Nudd William
Home Financials for this Owner
Home Financials are based on the most recent Mortgage that was taken out on this home.
Original Mortgage
$197,600
Outstanding Balance
$116,608
Interest Rate
6.83%
Mortgage Type
Purchase Money Mortgage
Estimated Equity
$201,590
Purchase Details
Closed on
Apr 1, 1999
Sold by
Chandresekhar Rajogopalan
Bought by
Hartl Nicholas J
Home Financials for this Owner
Home Financials are based on the most recent Mortgage that was taken out on this home.
Original Mortgage
$134,800
Interest Rate
7.1%
Mortgage Type
FHA
Purchase Details
Closed on
Oct 31, 1997
Sold by
Zaper Nick and Zaper Ann G
Bought by
Chandrasekhar Rajagopalan
Purchase Details
Closed on
Nov 11, 1996
Sold by
Zaper Nick and Zaper Ann G
Bought by
Zaper Nick and Zaper Ann G
Create a Home Valuation Report for This Property
The Home Valuation Report is an in-depth analysis detailing your home's value as well as a comparison with similar homes in the area
Home Values in the Area
Average Home Value in this Area
Purchase History
| Date | Buyer | Sale Price | Title Company |
|---|---|---|---|
| Thompson Emily M | -- | None Listed On Document | |
| Nudd William | $232,500 | Fox Title Company | |
| Hartl Nicholas J | $139,000 | -- | |
| Chandrasekhar Rajagopalan | $139,000 | Fox Title Company | |
| Zaper Nick | -- | -- |
Source: Public Records
Mortgage History
| Date | Status | Borrower | Loan Amount |
|---|---|---|---|
| Open | Nudd William | $197,600 | |
| Previous Owner | Hartl Nicholas J | $134,800 |
Source: Public Records
Tax History
| Year | Tax Paid | Tax Assessment Tax Assessment Total Assessment is a certain percentage of the fair market value that is determined by local assessors to be the total taxable value of land and additions on the property. | Land | Improvement |
|---|---|---|---|---|
| 2024 | $6,409 | $82,702 | $13,516 | $69,186 |
| 2023 | $6,043 | $75,630 | $12,360 | $63,270 |
| 2022 | $5,732 | $68,130 | $11,480 | $56,650 |
| 2021 | $5,456 | $64,730 | $10,910 | $53,820 |
| 2020 | $5,361 | $63,150 | $10,640 | $52,510 |
| 2019 | $6,028 | $70,020 | $10,760 | $59,260 |
| 2018 | $4,842 | $58,120 | $10,480 | $47,640 |
| 2017 | $4,562 | $53,870 | $9,710 | $44,160 |
| 2016 | $4,303 | $49,860 | $8,990 | $40,870 |
| 2015 | $4,189 | $46,530 | $8,390 | $38,140 |
| 2014 | $4,266 | $46,530 | $8,390 | $38,140 |
| 2013 | $4,298 | $48,120 | $8,680 | $39,440 |
Source: Public Records
Map
Nearby Homes
- 720 Hoover Dr Unit 124
- 832 Kansas St
- 861 Boone Dr
- 933 Columbia Ct
- 961 Dearborn Cir
- 143 W Elk Trail Unit 342
- 139 W Elk Trail Unit 239
- 147 W Elk Trail Unit 345
- 161 W Elk Trail Unit 263
- 107 W Elk Trail Unit 106
- 768 N Gary Ave Unit 103
- 764 N Gary Ave Unit 110
- 340 Klein Creek Ct Unit c
- 862 Omaha Ct
- 124 Klein Creek Ct Unit D
- 142 Klein Creek Ct Unit B
- 332 Klein Creek Ct Unit C
- 230 Klein Creek Ct Unit F
- 110 Klein Creek Ct Unit 3C
- 342 Klein Creek Ct Unit 5E
- 272 Eclipse Dr
- 276 Eclipse Dr Unit 315
- 280 Eclipse Dr
- 274 Eclipse Dr Unit 31
- 279 Camelot Ln
- 277 Eclipse Dr Unit 282
- 275 Eclipse Dr Unit 283
- 275 Camelot Ln Unit 334
- 270 Eclipse Dr Unit 312
- 277 Camelot Ln Unit 333
- 281 Camelot Ln Unit 331
- 273 Camelot Ln
- 268 Eclipse Dr Unit 311
- 279 Eclipse Dr Unit 281
- 271 Camelot Ln
- 739 Hoover Dr Unit 321
- 273 Eclipse Dr Unit 284
- 737 Hoover Dr Unit 322
- 735 Hoover Dr
- 731 Hoover Dr
Your Personal Tour Guide
Ask me questions while you tour the home.