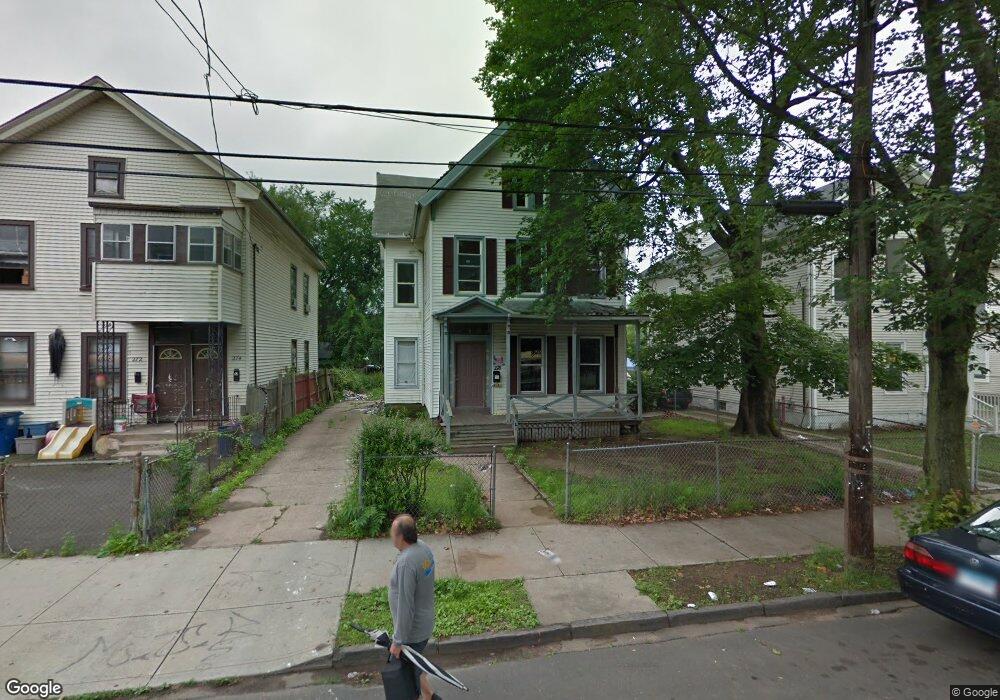
278 Exchange St New Haven, CT 06513
Fair Haven NeighborhoodEstimated Value: $283,897 - $381,000
6
Beds
4
Baths
2,367
Sq Ft
$145/Sq Ft
Est. Value
About This Home
This home is located at 278 Exchange St, New Haven, CT 06513 and is currently estimated at $342,974, approximately $144 per square foot. 278 Exchange St is a home located in New Haven County with nearby schools including Elm City College Preparatory School, Cold Spring School, and St Francis & St Rose Of Lima School.
Ownership History
Date
Name
Owned For
Owner Type
Purchase Details
Closed on
Jun 2, 2010
Sold by
Citimortgage Inc
Bought by
Paracha Raiza
Current Estimated Value
Purchase Details
Closed on
Feb 11, 2010
Sold by
Murat Carine
Bought by
Citimortgage Inc
Purchase Details
Closed on
May 26, 2006
Sold by
Relinquished Prop Llc
Bought by
Murat Carine
Home Financials for this Owner
Home Financials are based on the most recent Mortgage that was taken out on this home.
Original Mortgage
$193,600
Interest Rate
6.53%
Purchase Details
Closed on
Oct 20, 1999
Sold by
Bcic Funding Corp
Bought by
Exchange St Llc
Purchase Details
Closed on
May 1, 1991
Sold by
Fleet Finance Inc
Bought by
Palermo Michael R and Faron Marta J
Purchase Details
Closed on
Jan 29, 1991
Sold by
Gonzalez Jose
Bought by
Fleet Finance Inc
Create a Home Valuation Report for This Property
The Home Valuation Report is an in-depth analysis detailing your home's value as well as a comparison with similar homes in the area
Home Values in the Area
Average Home Value in this Area
Purchase History
| Date | Buyer | Sale Price | Title Company |
|---|---|---|---|
| Paracha Raiza | $53,000 | -- | |
| Citimortgage Inc | -- | -- | |
| Murat Carine | $242,000 | -- | |
| Exchange St Llc | $18,000 | -- | |
| Palermo Michael R | $115,500 | -- | |
| Fleet Finance Inc | $123,647 | -- |
Source: Public Records
Mortgage History
| Date | Status | Borrower | Loan Amount |
|---|---|---|---|
| Previous Owner | Fleet Finance Inc | $193,600 | |
| Previous Owner | Fleet Finance Inc | $75,000 |
Source: Public Records
Tax History Compared to Growth
Tax History
| Year | Tax Paid | Tax Assessment Tax Assessment Total Assessment is a certain percentage of the fair market value that is determined by local assessors to be the total taxable value of land and additions on the property. | Land | Improvement |
|---|---|---|---|---|
| 2025 | $5,268 | $133,700 | $41,860 | $91,840 |
| 2024 | $5,147 | $133,700 | $41,860 | $91,840 |
| 2023 | $4,974 | $133,700 | $41,860 | $91,840 |
| 2022 | $5,315 | $133,700 | $41,860 | $91,840 |
| 2021 | $3,542 | $80,710 | $33,530 | $47,180 |
| 2020 | $3,542 | $80,710 | $33,530 | $47,180 |
| 2019 | $3,469 | $80,710 | $33,530 | $47,180 |
| 2018 | $3,469 | $80,710 | $33,530 | $47,180 |
| 2017 | $3,122 | $80,710 | $33,530 | $47,180 |
| 2016 | $2,295 | $55,230 | $15,260 | $39,970 |
| 2015 | $2,295 | $55,230 | $15,260 | $39,970 |
| 2014 | $2,295 | $55,230 | $15,260 | $39,970 |
Source: Public Records
Map
Nearby Homes
- 56 Woolsey St
- 181 James St
- 187 Saltonstall Ave
- 114 Blatchley Ave
- 36 Shelter St
- 213 Saltonstall Ave
- 295 Lloyd St
- 308 Poplar St
- 35 Saltonstall Ave
- 83 James St
- 115 Clay St
- 85 Pierpont St
- 111 Chapel St
- 74 Fillmore St
- 72 Pierpont St
- 191 Ferry St
- 354 Blatchley Ave
- 121 Fillmore St
- 33 Chapel St
- 32 E Pearl St
- 278 Exchange St Unit 2nd/3rd Fl
- 272 Exchange St
- 282 Exchange St
- 268 Exchange St
- 284 Exchange St
- 184 Blatchley Ave
- 286 Exchange St
- 286 Exchange St Unit 3
- 286 Exchange St Unit 2
- 281 Exchange St
- 190 Blatchley Ave
- 178 Blatchley Ave
- 129 Wolcott St
- 133 Wolcott St
- 183 Lloyd St
- 137 Wolcott St
- 175 Lloyd St
- 288 Exchange St
- 174 Blatchley Ave
- 196 Blatchley Ave