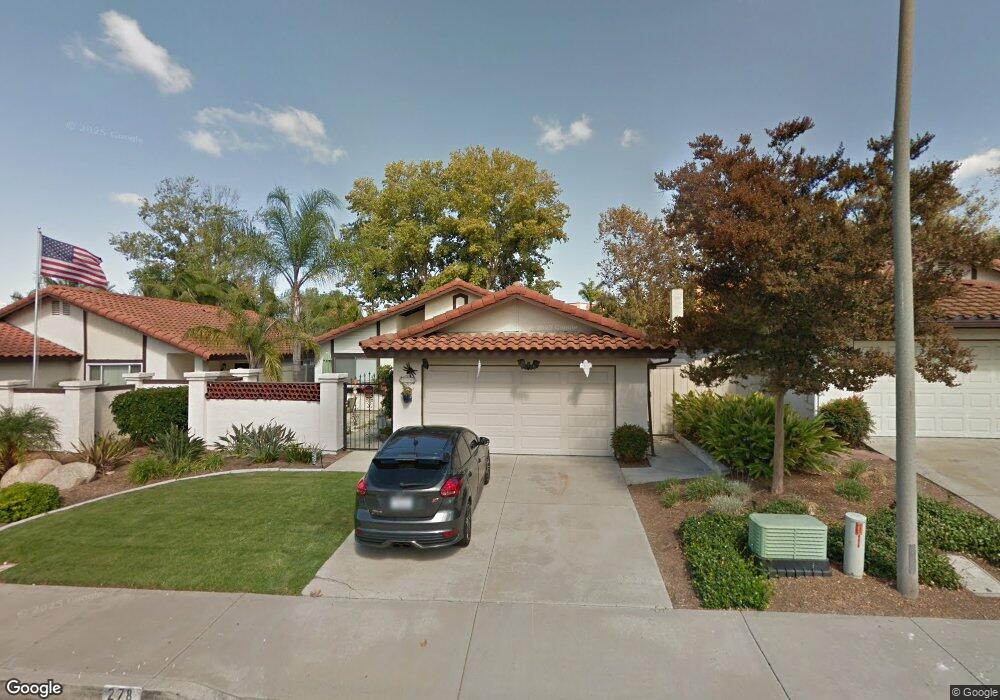
278 Manzanita Dr Oceanside, CA 92057
San Luis Rey NeighborhoodEstimated Value: $741,976 - $787,000
3
Beds
2
Baths
1,344
Sq Ft
$570/Sq Ft
Est. Value
About This Home
This home is located at 278 Manzanita Dr, Oceanside, CA 92057 and is currently estimated at $765,994, approximately $569 per square foot. 278 Manzanita Dr is a home located in San Diego County with nearby schools including Del Rio Elementary School, Cesar Chavez Middle School, and El Camino High School.
Ownership History
Date
Name
Owned For
Owner Type
Purchase Details
Closed on
Dec 21, 2015
Sold by
Sun Ming and Sun Ping Y
Bought by
Sun Family Trust
Current Estimated Value
Purchase Details
Closed on
May 20, 2010
Sold by
Aurora Loan Services Llc
Bought by
Sun Ming and Sun Ping Yang
Home Financials for this Owner
Home Financials are based on the most recent Mortgage that was taken out on this home.
Original Mortgage
$180,000
Outstanding Balance
$120,529
Interest Rate
5.03%
Mortgage Type
New Conventional
Estimated Equity
$645,465
Purchase Details
Closed on
Mar 12, 2010
Sold by
Hoskins Bruce Calvin and Hoskins Alice Taroma
Bought by
Aurora Loan Services Llc
Purchase Details
Closed on
Aug 31, 2004
Sold by
Irgens Mary L
Bought by
Hoskins Bruce Calvin and Hoskins Alice Taroma
Home Financials for this Owner
Home Financials are based on the most recent Mortgage that was taken out on this home.
Original Mortgage
$340,000
Interest Rate
5.75%
Mortgage Type
Unknown
Purchase Details
Closed on
Nov 30, 1990
Purchase Details
Closed on
Jan 28, 1986
Create a Home Valuation Report for This Property
The Home Valuation Report is an in-depth analysis detailing your home's value as well as a comparison with similar homes in the area
Home Values in the Area
Average Home Value in this Area
Purchase History
| Date | Buyer | Sale Price | Title Company |
|---|---|---|---|
| Sun Family Trust | -- | None Available | |
| Sun Ming | $240,000 | Advantage Title | |
| Aurora Loan Services Llc | $359,120 | Servicelink | |
| Hoskins Bruce Calvin | $426,000 | Lawyers Title Company | |
| -- | $145,000 | -- | |
| -- | $92,000 | -- |
Source: Public Records
Mortgage History
| Date | Status | Borrower | Loan Amount |
|---|---|---|---|
| Open | Sun Ming | $180,000 | |
| Previous Owner | Hoskins Bruce Calvin | $340,000 | |
| Closed | Hoskins Bruce Calvin | $85,000 |
Source: Public Records
Tax History Compared to Growth
Tax History
| Year | Tax Paid | Tax Assessment Tax Assessment Total Assessment is a certain percentage of the fair market value that is determined by local assessors to be the total taxable value of land and additions on the property. | Land | Improvement |
|---|---|---|---|---|
| 2025 | $3,447 | $309,782 | $193,616 | $116,166 |
| 2024 | $3,447 | $303,709 | $189,820 | $113,889 |
| 2023 | $3,341 | $297,755 | $186,099 | $111,656 |
| 2022 | $3,290 | $291,917 | $182,450 | $109,467 |
| 2021 | $3,303 | $286,194 | $178,873 | $107,321 |
| 2020 | $3,202 | $283,260 | $177,039 | $106,221 |
| 2019 | $3,110 | $277,707 | $173,568 | $104,139 |
| 2018 | $3,077 | $272,263 | $170,165 | $102,098 |
| 2017 | $3,021 | $266,926 | $166,829 | $100,097 |
| 2016 | $2,923 | $261,693 | $163,558 | $98,135 |
| 2015 | $2,838 | $257,763 | $161,102 | $96,661 |
| 2014 | $2,730 | $252,715 | $157,947 | $94,768 |
Source: Public Records
Map
Nearby Homes
- 4791 Macadamia Ct
- 4843 Sagina Ct Unit 6
- 4819 Gardenia St
- 267 Oleander Dr
- 207 Carissa Dr
- 5202 Via Tizon
- 790 Mosaic Cir
- 4827 Luna Dr
- 838 Mosaic Cir
- 5030 Gavilan Way Unit 45
- 852 Essence Ave
- 4816 Siesta Dr
- 5005 Codorniz Way Unit 8
- 232 Manzanilla Way
- 652 Montage Rd
- 689 Wolf Point Ct
- 5037 Los Morros Way Unit 71
- 5110 N River Rd Unit E
- 150 N River Cir Unit 105
- 838 Masters Dr
- 282 Manzanita Dr
- 274 Manzanita Dr
- 270 Manzanita Dr
- 277 Manzanita Dr
- 281 Manzanita Dr
- 4845 Mimosa Ct
- 266 Manzanita Dr
- 285 Manzanita Dr
- 4841 Mimosa Ct
- 289 Manzanita Dr
- 262 Manzanita Dr
- 261 Saguaro Place
- 4837 Mimosa Ct
- 4878 Yuma Ave
- 257 Saguaro Place
- 258 Manzanita Dr
- 257 Manzanita Dr
- 253 Saguaro Place
- 254 Manzanita Dr
- 253 Manzanita Dr