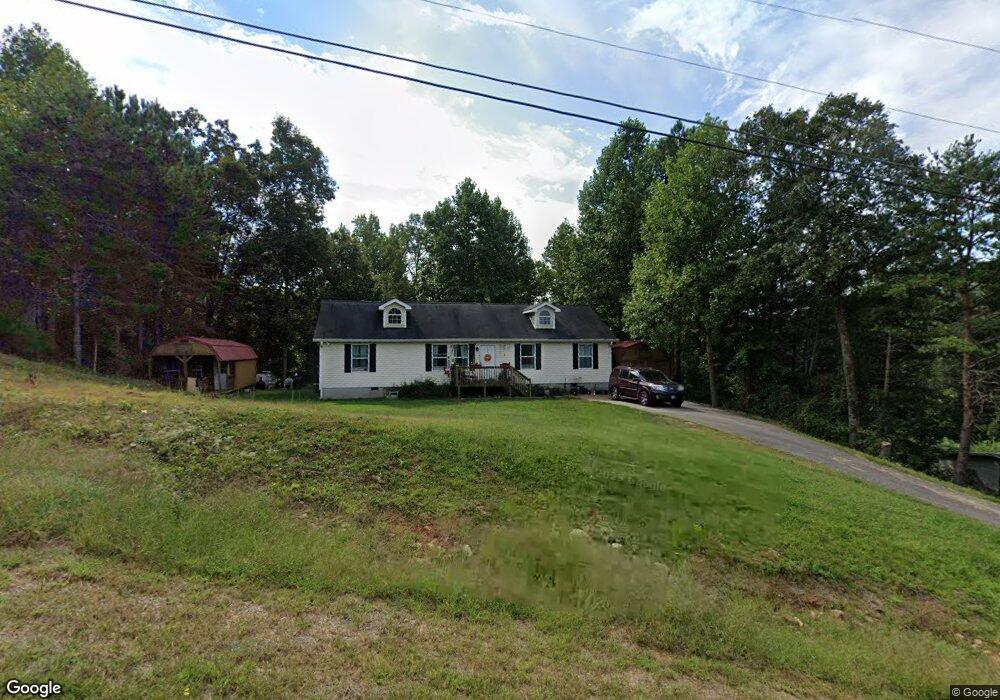
278 Robin Hood Dr Unit 32 Murrayville, GA 30564
Murrayville NeighborhoodEstimated Value: $278,000 - $316,000
4
Beds
2
Baths
1,456
Sq Ft
$204/Sq Ft
Est. Value
About This Home
This home is located at 278 Robin Hood Dr Unit 32, Murrayville, GA 30564 and is currently estimated at $297,165, approximately $204 per square foot. 278 Robin Hood Dr Unit 32 is a home located in Lumpkin County with nearby schools including Lumpkin County High School.
Ownership History
Date
Name
Owned For
Owner Type
Purchase Details
Closed on
Aug 4, 2017
Sold by
Kahan Charlee L
Bought by
Kahan Kurt S
Current Estimated Value
Purchase Details
Closed on
Jun 23, 2005
Sold by
Poplar Properties
Bought by
Leister Eric A and Leister Carie
Home Financials for this Owner
Home Financials are based on the most recent Mortgage that was taken out on this home.
Original Mortgage
$110,320
Interest Rate
5.5%
Mortgage Type
New Conventional
Purchase Details
Closed on
Apr 20, 2005
Sold by
Mariah Construction Llp
Bought by
Poplar Properties Inc
Home Financials for this Owner
Home Financials are based on the most recent Mortgage that was taken out on this home.
Original Mortgage
$32,000
Interest Rate
5.99%
Mortgage Type
New Conventional
Purchase Details
Closed on
Jan 18, 2000
Bought by
Mariah Construction Llp
Create a Home Valuation Report for This Property
The Home Valuation Report is an in-depth analysis detailing your home's value as well as a comparison with similar homes in the area
Home Values in the Area
Average Home Value in this Area
Purchase History
| Date | Buyer | Sale Price | Title Company |
|---|---|---|---|
| Kahan Kurt S | -- | -- | |
| Kahan Kurt S | $110,000 | -- | |
| Leister Eric A | $137,900 | -- | |
| Poplar Properties Inc | $32,500 | -- | |
| Mariah Construction Llp | $240,000 | -- |
Source: Public Records
Mortgage History
| Date | Status | Borrower | Loan Amount |
|---|---|---|---|
| Previous Owner | Leister Eric A | $110,320 | |
| Previous Owner | Leister Eric A | $13,790 | |
| Previous Owner | Poplar Properties Inc | $32,000 |
Source: Public Records
Tax History Compared to Growth
Tax History
| Year | Tax Paid | Tax Assessment Tax Assessment Total Assessment is a certain percentage of the fair market value that is determined by local assessors to be the total taxable value of land and additions on the property. | Land | Improvement |
|---|---|---|---|---|
| 2024 | $29 | $91,268 | $10,000 | $81,268 |
| 2023 | $56 | $85,169 | $10,000 | $75,169 |
| 2022 | $110 | $72,948 | $10,000 | $62,948 |
| 2021 | $1,721 | $60,664 | $10,000 | $50,664 |
| 2020 | $1,560 | $54,991 | $6,000 | $48,991 |
| 2019 | $1,560 | $54,991 | $6,000 | $48,991 |
| 2018 | $1,389 | $48,960 | $6,000 | $42,960 |
| 2017 | $1,319 | $45,590 | $6,000 | $39,590 |
| 2016 | $1,238 | $41,404 | $6,000 | $35,404 |
| 2015 | $1,102 | $41,404 | $6,000 | $35,404 |
| 2014 | $1,102 | $41,793 | $6,000 | $35,793 |
| 2013 | -- | $42,182 | $6,000 | $36,182 |
Source: Public Records
Map
Nearby Homes
- 1433 Mount Olive Church Rd
- 1405 Mount Olive Church Rd
- 118 Pine Corner Dr
- 119 Pine Corner Dr
- 112 Pine Corner Dr
- 136 Ladyslipper Ln
- 219 John Garner Rd
- 8641 Highway 52 E
- 151 Norris Rd
- 0 Myrtle Dr Unit 7650061
- 0 Myrtle Dr Unit 10607430
- 12 Katydid Ln
- 0 Conner Dr
- 6147 Dahlonega Hwy
- 5416 Oak Manor Way Unit LOT 4
- 5416 Oak Manor Way
- 100 Rocky Branch Dr
- 238 Sunrise Trail
- 600 Chapman Ridge Ln
- 278 Robin Hood Dr
- 300 Robin Hood Dr
- 266 Robin Hood Dr
- 326 Robin Hood Dr Unit 34
- 326 Robin Hood Dr
- 211 Robin Hood Dr
- 343 Robin Hood Dr
- 386 Robin Hood Dr
- 218 Robin Hood Dr
- 428 Robin Hood Dr
- 75 Nottingham Ln Unit 40
- 75 Nottingham Ln
- 129 Nottingham Ln
- 379 Robin Hood Dr
- 164 Robin Hood Dr
- 442 Robin Hood Dr
- 161 Nottingham Ln
- 437 Robin Hood Dr
- 180 Nottingham Ln
- 181 Nottingham Ln