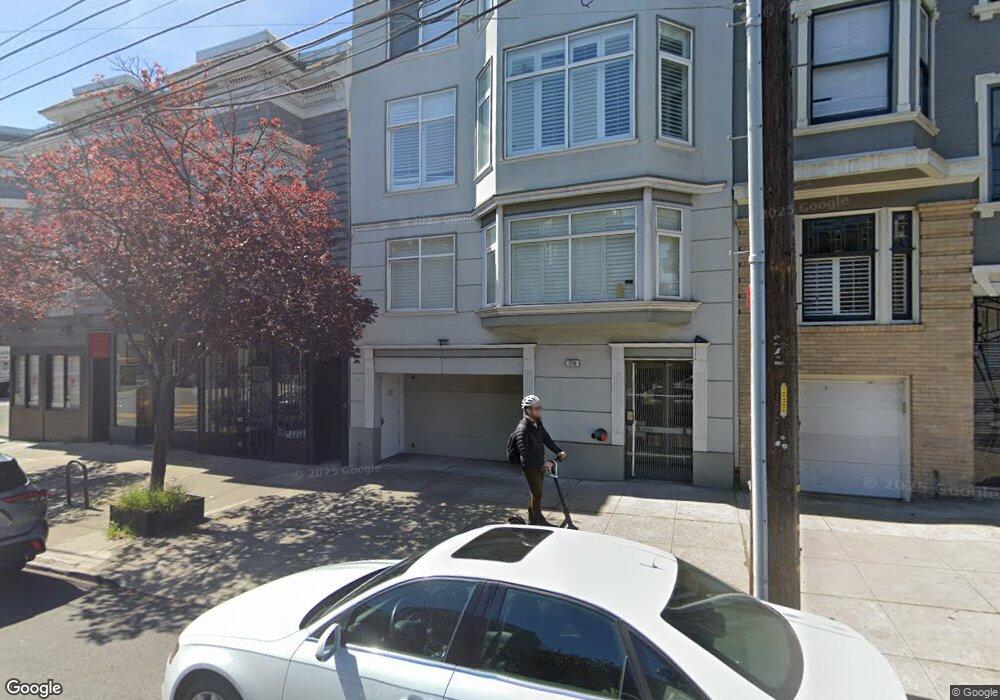
278 Sanchez St Unit 1 San Francisco, CA 94114
Eureka Valley-Dolores Heights NeighborhoodEstimated Value: $1,879,000 - $2,082,253
3
Beds
3
Baths
1,755
Sq Ft
$1,126/Sq Ft
Est. Value
About This Home
This home is located at 278 Sanchez St Unit 1, San Francisco, CA 94114 and is currently estimated at $1,975,563, approximately $1,125 per square foot. 278 Sanchez St Unit 1 is a home located in San Francisco County with nearby schools including Sanchez Elementary, Everett Middle School, and Children's Day School.
Ownership History
Date
Name
Owned For
Owner Type
Purchase Details
Closed on
Apr 25, 2016
Sold by
Norman Charles E
Bought by
Lin Kevin
Current Estimated Value
Purchase Details
Closed on
Nov 15, 1995
Sold by
Margrey Jay F and Modes James Patrick
Bought by
Norman Charles E
Home Financials for this Owner
Home Financials are based on the most recent Mortgage that was taken out on this home.
Original Mortgage
$328,000
Interest Rate
7.51%
Purchase Details
Closed on
Dec 5, 1994
Sold by
Murphy Thomas F
Bought by
Margrey Jay F and Modes James Patrick
Purchase Details
Closed on
Jul 12, 1994
Sold by
Murphy Thomas F
Bought by
Margrey Jay F and Modes James Patrick
Home Financials for this Owner
Home Financials are based on the most recent Mortgage that was taken out on this home.
Original Mortgage
$300,000
Interest Rate
4.85%
Create a Home Valuation Report for This Property
The Home Valuation Report is an in-depth analysis detailing your home's value as well as a comparison with similar homes in the area
Home Values in the Area
Average Home Value in this Area
Purchase History
| Date | Buyer | Sale Price | Title Company |
|---|---|---|---|
| Lin Kevin | $1,850,000 | Old Republic Title Company | |
| Norman Charles E | $410,000 | Commonwealth Land Title Co | |
| Margrey Jay F | -- | First American Title Co | |
| Margrey Jay F | -- | First American Title Company |
Source: Public Records
Mortgage History
| Date | Status | Borrower | Loan Amount |
|---|---|---|---|
| Previous Owner | Norman Charles E | $328,000 | |
| Previous Owner | Margrey Jay F | $300,000 |
Source: Public Records
Tax History Compared to Growth
Tax History
| Year | Tax Paid | Tax Assessment Tax Assessment Total Assessment is a certain percentage of the fair market value that is determined by local assessors to be the total taxable value of land and additions on the property. | Land | Improvement |
|---|---|---|---|---|
| 2025 | $26,341 | $2,190,018 | $1,095,009 | $1,095,009 |
| 2024 | $26,341 | $2,147,078 | $1,073,539 | $1,073,539 |
| 2023 | $25,904 | $2,104,980 | $1,052,490 | $1,052,490 |
| 2022 | $25,400 | $2,063,706 | $1,031,853 | $1,031,853 |
| 2021 | $24,949 | $2,023,242 | $1,011,621 | $1,011,621 |
| 2020 | $25,100 | $2,002,498 | $1,001,249 | $1,001,249 |
| 2019 | $23,997 | $1,963,234 | $981,617 | $981,617 |
| 2018 | $23,192 | $1,924,740 | $962,370 | $962,370 |
| 2017 | $23,101 | $1,887,000 | $943,500 | $943,500 |
| 2016 | $7,163 | $575,359 | $168,393 | $406,966 |
| 2015 | $7,073 | $566,717 | $165,864 | $400,853 |
| 2014 | $6,889 | $555,616 | $162,615 | $393,001 |
Source: Public Records
Map
Nearby Homes
- 2256 Market St
- 370 Church St Unit G
- 2260 Market St
- 3386 16th St
- 367 Church St Unit 5
- 2152 15th St
- 3749 17th St Unit B
- 3747 17th St
- 12 Beaver St
- 516 Church St
- 2317-2335 Market St
- 22 Beaver St
- 350 Dolores St
- 380 Dolores St Unit 10
- 380 Dolores St Unit 9
- 67 Belcher St
- 146 Henry St
- 120-124 Dolores St
- 167 Dolores St
- 262 Castro St
- 278 Sanchez St
- 278 Sanchez St Unit 3
- 278 Sanchez St Unit 2
- 282-290 Sanchez St
- 252 Sanchez St Unit C
- 252 Sanchez St Unit B
- 252 Sanchez St Unit A
- 3512 16th St
- 246 Sanchez St Unit C
- 246 Sanchez St Unit B
- 246 Sanchez St Unit A
- 269 Sanchez St
- 304 Sanchez St
- 300 Sanchez St
- 2243 Market St
- 302 Sanchez St
- 3511 16th St
- 279 Sanchez St Unit 285
- 3509 16th St
- 2213 Market St