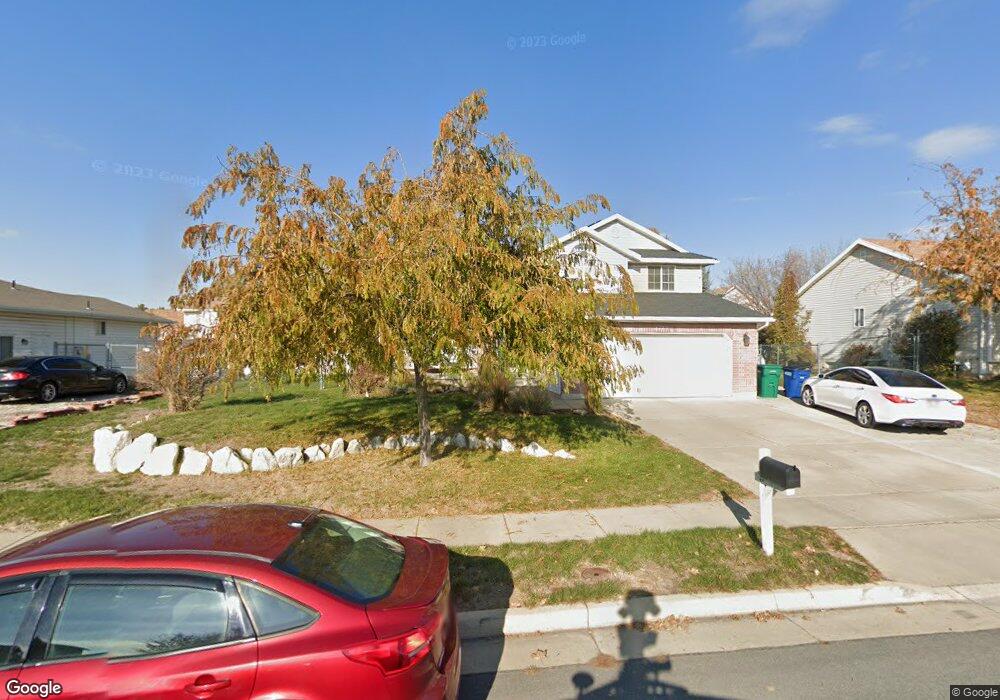
2780 Brady Way Layton, UT 84041
Estimated Value: $502,000 - $525,000
3
Beds
3
Baths
2,378
Sq Ft
$215/Sq Ft
Est. Value
About This Home
This home is located at 2780 Brady Way, Layton, UT 84041 and is currently estimated at $510,941, approximately $214 per square foot. 2780 Brady Way is a home located in Davis County with nearby schools including Legacy Junior High School, Layton High School, and North Davis Preparatory Academy.
Ownership History
Date
Name
Owned For
Owner Type
Purchase Details
Closed on
May 17, 2012
Sold by
The Secretary Of Housing & Urban Develop
Bought by
Long Michael
Current Estimated Value
Home Financials for this Owner
Home Financials are based on the most recent Mortgage that was taken out on this home.
Original Mortgage
$9,356
Outstanding Balance
$6,424
Interest Rate
3.86%
Mortgage Type
Stand Alone Second
Estimated Equity
$504,517
Purchase Details
Closed on
Sep 27, 2011
Sold by
Us Bank National Association
Bought by
The Secretary Of Housing & Urban Develop
Purchase Details
Closed on
Sep 14, 2011
Sold by
Williams Stanley and Williams Amelia
Bought by
U S Bank National Association
Purchase Details
Closed on
Feb 12, 2008
Sold by
Sharp Jeffrey R and Sharp Heidi S
Bought by
Williams Stanley and Williams Amelia
Home Financials for this Owner
Home Financials are based on the most recent Mortgage that was taken out on this home.
Original Mortgage
$209,709
Interest Rate
6.04%
Mortgage Type
FHA
Create a Home Valuation Report for This Property
The Home Valuation Report is an in-depth analysis detailing your home's value as well as a comparison with similar homes in the area
Home Values in the Area
Average Home Value in this Area
Purchase History
| Date | Buyer | Sale Price | Title Company |
|---|---|---|---|
| Long Michael | -- | Williams Title Guara | |
| The Secretary Of Housing & Urban Develop | -- | None Available | |
| U S Bank National Association | $221,650 | None Available | |
| Williams Stanley | -- | First American Title |
Source: Public Records
Mortgage History
| Date | Status | Borrower | Loan Amount |
|---|---|---|---|
| Open | Long Michael | $9,356 | |
| Open | Long Michael | $155,944 | |
| Previous Owner | Williams Stanley | $209,709 |
Source: Public Records
Tax History
| Year | Tax Paid | Tax Assessment Tax Assessment Total Assessment is a certain percentage of the fair market value that is determined by local assessors to be the total taxable value of land and additions on the property. | Land | Improvement |
|---|---|---|---|---|
| 2025 | $2,478 | $260,150 | $107,311 | $152,839 |
| 2024 | $2,393 | $253,000 | $119,442 | $133,558 |
| 2023 | $2,275 | $424,000 | $116,719 | $307,281 |
| 2022 | $2,462 | $249,150 | $73,986 | $175,164 |
| 2021 | $2,233 | $337,000 | $111,011 | $225,989 |
| 2020 | $2,016 | $292,000 | $93,095 | $198,905 |
| 2019 | $1,953 | $277,000 | $96,424 | $180,576 |
| 2018 | $1,756 | $250,000 | $84,469 | $165,531 |
| 2016 | $1,503 | $110,385 | $32,727 | $77,658 |
| 2015 | $1,426 | $99,440 | $32,727 | $66,713 |
| 2014 | $1,446 | $103,072 | $32,727 | $70,345 |
| 2013 | -- | $100,464 | $28,952 | $71,512 |
Source: Public Records
Map
Nearby Homes
- 1250 N 2925 W
- 1445 N 2925 W
- 2601 S 200 E
- 154 E 2325 S
- 2127 S 350 E
- 2480 S Main St
- 308 E 1925 S
- 1477 N 2375 W
- 818 N 2625 W
- 1141 N 2275 W
- 1961 S 100 W
- 460 E 1700 S Unit 1 & 2
- 2057 S James Cir
- 1491 N 1875 W
- 1491 N 1875 W Unit 158
- 1487 N 1875 W
- 1487 N 1875 W Unit 159
- 1483 N 1875 W
- 1479 N 1875 W
- 1479 N 1875 W Unit 161
- 2768 Brady Way
- 2792 Brady Way
- 2819 Lindi Way
- 2819 W Lindi Way
- 2827 Lindi Way
- 2827 W Lindi St
- 2807 Lindi Way
- 2807 W Lindi Way
- 2756 Brady Way
- 2804 Brady Way
- 2767 Brady Way
- 2839 W Lindi St
- 2839 Lindi Way
- 2755 Brady Way
- 2791 Brady Way
- 2793 Lindi Way
- 2793 W Lindi Way
- 2816 Brady Way
- 2744 Brady Way
- 2741 Brady Way