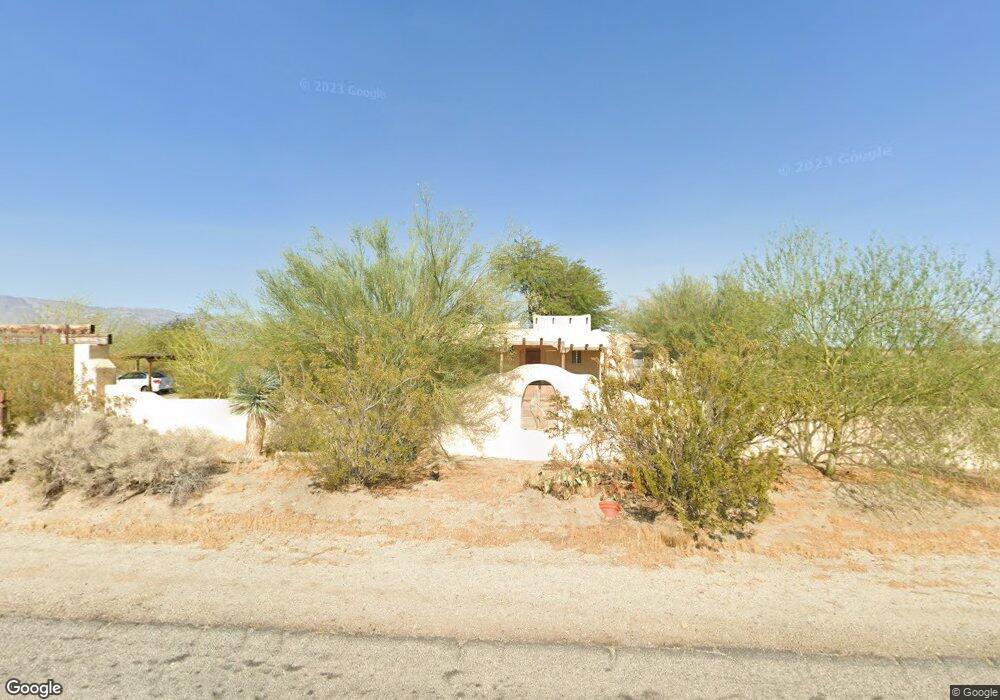
2781 Double O Rd Borrego Springs, CA 92004
Estimated Value: $224,000 - $397,000
2
Beds
1
Bath
894
Sq Ft
$340/Sq Ft
Est. Value
About This Home
This home is located at 2781 Double O Rd, Borrego Springs, CA 92004 and is currently estimated at $303,545, approximately $339 per square foot. 2781 Double O Rd is a home located in San Diego County with nearby schools including Borrego Springs Elementary School, Borrego Springs Middle School, and Borrego Springs High School.
Ownership History
Date
Name
Owned For
Owner Type
Purchase Details
Closed on
Apr 9, 2010
Sold by
Us Bank National Association
Bought by
Freeman Betty
Current Estimated Value
Purchase Details
Closed on
Dec 21, 2009
Sold by
Hurley Margaret
Bought by
Us Bank National Association
Purchase Details
Closed on
Mar 7, 1997
Sold by
Shields W L
Bought by
Hurley Margaret
Home Financials for this Owner
Home Financials are based on the most recent Mortgage that was taken out on this home.
Original Mortgage
$63,450
Interest Rate
7.58%
Purchase Details
Closed on
Mar 1, 1996
Sold by
Lloyd Alfred J and Lloyd Patricia Ann
Bought by
Shields W L
Home Financials for this Owner
Home Financials are based on the most recent Mortgage that was taken out on this home.
Original Mortgage
$10,000
Interest Rate
7.05%
Mortgage Type
Seller Take Back
Create a Home Valuation Report for This Property
The Home Valuation Report is an in-depth analysis detailing your home's value as well as a comparison with similar homes in the area
Home Values in the Area
Average Home Value in this Area
Purchase History
| Date | Buyer | Sale Price | Title Company |
|---|---|---|---|
| Freeman Betty | $83,000 | Lsi Title Company | |
| Us Bank National Association | $69,669 | Accommodation | |
| Hurley Margaret | $70,500 | Commonwealth Title Co | |
| Shields W L | $16,000 | Old Republic Title Company |
Source: Public Records
Mortgage History
| Date | Status | Borrower | Loan Amount |
|---|---|---|---|
| Previous Owner | Hurley Margaret | $63,450 | |
| Previous Owner | Shields W L | $10,000 | |
| Closed | Shields W L | $36,000 |
Source: Public Records
Tax History Compared to Growth
Tax History
| Year | Tax Paid | Tax Assessment Tax Assessment Total Assessment is a certain percentage of the fair market value that is determined by local assessors to be the total taxable value of land and additions on the property. | Land | Improvement |
|---|---|---|---|---|
| 2025 | $1,228 | $106,607 | $54,980 | $51,627 |
| 2024 | $1,228 | $104,517 | $53,902 | $50,615 |
| 2023 | $1,203 | $102,469 | $52,846 | $49,623 |
| 2022 | $1,186 | $100,460 | $51,810 | $48,650 |
| 2021 | $1,167 | $98,492 | $50,795 | $47,697 |
| 2020 | $1,164 | $97,483 | $50,275 | $47,208 |
| 2019 | $1,087 | $95,573 | $49,290 | $46,283 |
| 2018 | $1,067 | $93,700 | $48,324 | $45,376 |
| 2017 | $1,047 | $91,864 | $47,377 | $44,487 |
| 2016 | $1,024 | $90,064 | $46,449 | $43,615 |
| 2015 | $1,010 | $88,712 | $45,752 | $42,960 |
| 2014 | $989 | $86,975 | $44,856 | $42,119 |
Source: Public Records
Map
Nearby Homes
- 4801 Borrego Springs Rd
- 2768 Borrego Springs Rd
- 0 Double O Rd Unit NDP2506291
- 0 Double O Rd Unit NDP2506289
- Lot 9 Frying Pan Rd
- 2960 Frying Pan Rd
- 0 Country Club Unit 180054291
- 2610 Double O Rd
- 0 Flying U Rd Unit 24-446993
- 0 Borrego Springs Rd Unit DW25218764
- 0 Borrego Springs Rd Unit 24718982
- 0 Borrego Springs Rd Unit 24718979
- 0 Borrego Springs Rd Unit NDP2506242
- 0 Borrego Springs Rd Unit NDP2506240
- 0 Borrego Springs Rd Unit NDP2506227
- 0 Borrego Springs Rd Unit DW25134859
- 0 Borrego Springs Rd Unit 131 250024930
- 0 Borrego Springs Rd Unit 24-449323
- 218 Borrego Springs Rd
- 45 Rocking Chair Dr
- 2797 Double O Rd
- 2765 Double O Rd
- 784 Weather Vane Dr
- 2815 Double O Rd
- 2817 Double O Rd
- 2810 Double O Rd
- 2825 Double O Rd
- 2760 Double O Rd
- 2827 Double O Rd
- 2785 Frying Pan Rd
- Double O R Tilting T Dr
- Double O Rd ,Bo Tilting T Dr Unit 34
- 763 Weather Vane Dr
- 2835 Double O Rd
- 2837 Double O Rd
- 165 Double O Rd
- 163 Double O Rd
- 138 Double O Rd
- 137 Double O Rd
- 133 Double O Rd