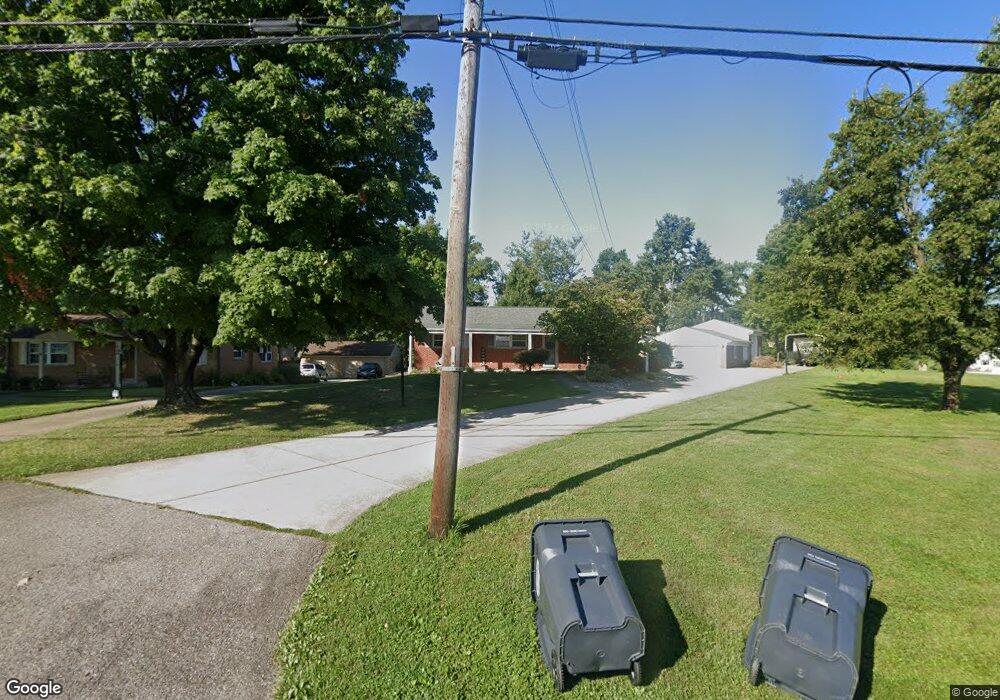
2785 Devils Backbone Rd Cincinnati, OH 45233
Estimated Value: $270,164 - $375,000
3
Beds
1
Bath
1,260
Sq Ft
$252/Sq Ft
Est. Value
About This Home
This home is located at 2785 Devils Backbone Rd, Cincinnati, OH 45233 and is currently estimated at $318,041, approximately $252 per square foot. 2785 Devils Backbone Rd is a home located in Hamilton County with nearby schools including John Foster Dulles Elementary School, Rapid Run Middle School, and Oak Hills High School.
Ownership History
Date
Name
Owned For
Owner Type
Purchase Details
Closed on
Mar 20, 2020
Sold by
Kramer Betty L
Bought by
Hall Elizabeth and Hall Michael I
Current Estimated Value
Home Financials for this Owner
Home Financials are based on the most recent Mortgage that was taken out on this home.
Original Mortgage
$225,834
Outstanding Balance
$197,876
Interest Rate
3.4%
Mortgage Type
FHA
Estimated Equity
$120,165
Purchase Details
Closed on
May 22, 2013
Sold by
Vandao Toi and Nguyen Thuynga Thi
Bought by
Dao Tien
Home Financials for this Owner
Home Financials are based on the most recent Mortgage that was taken out on this home.
Original Mortgage
$68,870
Interest Rate
3.38%
Mortgage Type
New Conventional
Purchase Details
Closed on
Dec 21, 2004
Sold by
Kramer Betty I and Kramer Ronald A
Bought by
Kramer Ronald A and Kramer Betty I
Create a Home Valuation Report for This Property
The Home Valuation Report is an in-depth analysis detailing your home's value as well as a comparison with similar homes in the area
Home Values in the Area
Average Home Value in this Area
Purchase History
| Date | Buyer | Sale Price | Title Company |
|---|---|---|---|
| Hall Elizabeth | $230,000 | Mattingly Ford Ttl Svcs Llc | |
| Dao Tien | $71,000 | None Available | |
| Kramer Ronald A | -- | -- |
Source: Public Records
Mortgage History
| Date | Status | Borrower | Loan Amount |
|---|---|---|---|
| Open | Hall Elizabeth | $225,834 | |
| Previous Owner | Dao Tien | $68,870 |
Source: Public Records
Tax History
| Year | Tax Paid | Tax Assessment Tax Assessment Total Assessment is a certain percentage of the fair market value that is determined by local assessors to be the total taxable value of land and additions on the property. | Land | Improvement |
|---|---|---|---|---|
| 2025 | $4,150 | $79,209 | $13,899 | $65,310 |
| 2024 | $4,066 | $79,209 | $13,899 | $65,310 |
| 2023 | $4,057 | $79,209 | $13,899 | $65,310 |
| 2022 | $4,113 | $64,933 | $12,968 | $51,965 |
| 2021 | $3,701 | $64,933 | $12,968 | $51,965 |
| 2020 | $3,087 | $64,933 | $12,968 | $51,965 |
| 2019 | $2,652 | $52,679 | $11,578 | $41,101 |
| 2018 | $2,656 | $52,679 | $11,578 | $41,101 |
| 2017 | $2,506 | $52,679 | $11,578 | $41,101 |
| 2016 | $2,384 | $50,506 | $11,456 | $39,050 |
| 2015 | $2,405 | $50,506 | $11,456 | $39,050 |
| 2014 | $2,408 | $50,506 | $11,456 | $39,050 |
| 2013 | $2,198 | $49,515 | $11,232 | $38,283 |
Source: Public Records
Map
Nearby Homes
- 2659 Devils Backbone Rd
- 2417 Quail Run Farm Ln
- 6944 Old Stone Ridge
- 2239 Quail Run Farm Ln
- 6233 Sharlene Dr
- 6090 Muddy Creek Rd
- 6040 Countrymeadow Ln
- 3388 Markdale Ct
- 6684 Powner Farm Dr
- 7284 Kirkridge Dr
- 5961 Lawrence Rd
- 1711 Ebenezer Rd
- 5918 Leeside Trail
- 3433 Tolland Ct
- 1659 Devils Backbone Rd
- 3311 Starhaven Trail
- 5869 Weston Ct
- 1259 Wexford Ln
- 1287 Heather Ridge
- 3454 Eyrich Rd
- 6606 Woodcrest Dr
- 2769 Devils Backbone Rd
- 6618 Woodcrest Dr
- 2831 Devils Backbone Rd
- 2794 Devils Backbone Rd
- 6630 Woodcrest Dr
- 2741 Devils Backbone Rd
- 6636 Woodcrest Dr
- 2780 Devils Backbone Rd
- 2824 Devils Backbone Rd
- 6642 Woodcrest Dr
- 6601 S Cove Dr
- 2723 Devils Backbone Rd
- 2750 Devils Backbone Rd
- 2846 Devils Backbone Rd
- 6602 S Cove Dr
- 6609 Woodcrest Dr
- 6648 Woodcrest Dr
- 6633 Woodcrest Dr
- 2868 Devils Backbone Rd
Your Personal Tour Guide
Ask me questions while you tour the home.