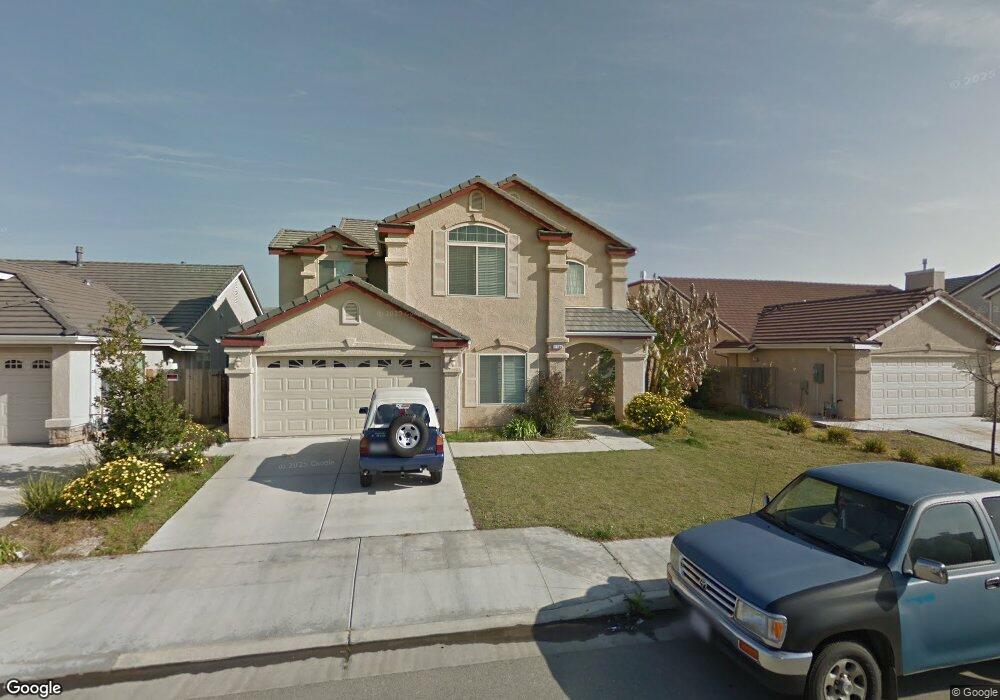
2786 N Apricot Ave Fresno, CA 93727
McLane NeighborhoodEstimated Value: $526,000 - $561,000
4
Beds
3
Baths
2,398
Sq Ft
$227/Sq Ft
Est. Value
About This Home
This home is located at 2786 N Apricot Ave, Fresno, CA 93727 and is currently estimated at $544,233, approximately $226 per square foot. 2786 N Apricot Ave is a home located in Fresno County with nearby schools including Reyburn Intermediate School, Clovis East High School, and Clovis Christian Schools.
Ownership History
Date
Name
Owned For
Owner Type
Purchase Details
Closed on
Mar 22, 2021
Sold by
Xiong Rick
Bought by
Xiong Rick and Vangxiong Shoua
Current Estimated Value
Home Financials for this Owner
Home Financials are based on the most recent Mortgage that was taken out on this home.
Original Mortgage
$209,000
Outstanding Balance
$171,377
Interest Rate
2.73%
Mortgage Type
New Conventional
Estimated Equity
$372,856
Purchase Details
Closed on
Mar 6, 2006
Sold by
Bn 5233 Lp
Bought by
Xiong Rick
Home Financials for this Owner
Home Financials are based on the most recent Mortgage that was taken out on this home.
Original Mortgage
$298,087
Interest Rate
2%
Mortgage Type
Negative Amortization
Purchase Details
Closed on
Nov 16, 2005
Sold by
Xiong Shoua Vang
Bought by
Xiong Rick
Home Financials for this Owner
Home Financials are based on the most recent Mortgage that was taken out on this home.
Original Mortgage
$37,261
Interest Rate
6.19%
Mortgage Type
Credit Line Revolving
Create a Home Valuation Report for This Property
The Home Valuation Report is an in-depth analysis detailing your home's value as well as a comparison with similar homes in the area
Home Values in the Area
Average Home Value in this Area
Purchase History
| Date | Buyer | Sale Price | Title Company |
|---|---|---|---|
| Xiong Rick | -- | Timios Title A Ca Corp | |
| Xiong Rick | $373,000 | Chicago Title Company | |
| Xiong Rick | -- | Chicago Title Company |
Source: Public Records
Mortgage History
| Date | Status | Borrower | Loan Amount |
|---|---|---|---|
| Open | Xiong Rick | $209,000 | |
| Closed | Xiong Rick | $298,087 | |
| Previous Owner | Xiong Rick | $37,261 |
Source: Public Records
Tax History Compared to Growth
Tax History
| Year | Tax Paid | Tax Assessment Tax Assessment Total Assessment is a certain percentage of the fair market value that is determined by local assessors to be the total taxable value of land and additions on the property. | Land | Improvement |
|---|---|---|---|---|
| 2025 | $6,304 | $509,038 | $170,816 | $338,222 |
| 2023 | $5,639 | $463,500 | $113,000 | $350,500 |
| 2022 | $5,487 | $450,100 | $109,800 | $340,300 |
| 2021 | $4,653 | $384,800 | $93,900 | $290,900 |
| 2020 | $4,257 | $349,900 | $85,400 | $264,500 |
| 2019 | $4,094 | $335,000 | $81,800 | $253,200 |
| 2018 | $3,945 | $325,400 | $79,500 | $245,900 |
| 2017 | $3,709 | $307,000 | $75,000 | $232,000 |
| 2016 | $3,344 | $280,000 | $75,000 | $205,000 |
| 2015 | $3,204 | $262,000 | $70,000 | $192,000 |
| 2014 | $3,218 | $262,000 | $70,000 | $192,000 |
Source: Public Records
Map
Nearby Homes
- 2648 N Armstrong Ave
- 2788 N Douglas Ave
- 2756 N Douglas Ave
- 2833 N Armstrong Ave
- 2871 N Cypress Ave
- 6435 E Millie Dr
- 7063 E Brown Ave
- 3062 N Filbert Ave
- 6399 E Millie Dr
- 2735 N Redda Rd
- 2819 N Redda Rd
- 6351 E Millie Dr
- 6647 E Vassar Ave
- 2273 N Raleigh Dr
- 6559 E Berkeley Ave
- 2701 N Dee Ann Ave
- 6660 E Yale Ave
- 6734 E Cambridge Ave
- 6691 E Harvard Ave
- 2698 N Arroyo Ave
- 2802 N Apricot Ave
- 2770 N Apricot Ave
- 2765 N Mckelvey Ave
- 2777 N Mckelvey Ave
- 2818 N Apricot Ave
- 2753 N Mckelvey Ave
- 6729 E Michigan Ave
- 6730 E Princeton Ave
- 2754 N Apricot Ave
- 2789 N Mckelvey Ave
- 2741 N Mckelvey Ave
- 2834 N Apricot Ave
- 6716 E Princeton Ave
- 6715 E Michigan Ave
- 6741 E Princeton Ave
- 2805 N Mckelvey Ave
- 6730 E Michigan Ave
- 2729 N Mckelvey Ave
- 6727 E Princeton Ave
- 6781 E Michigan Ave