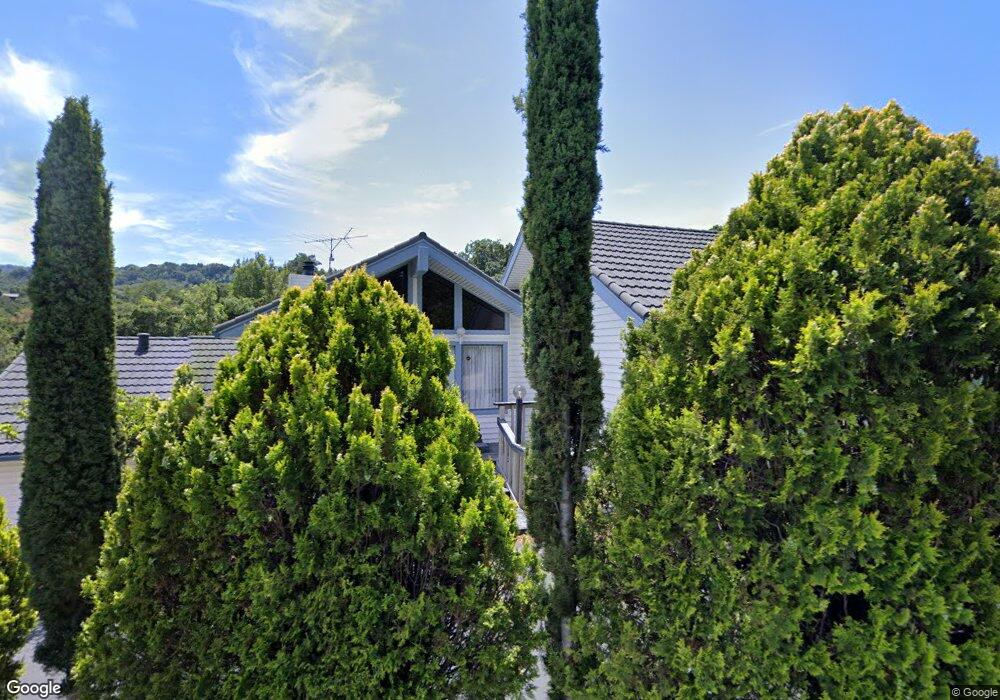
27866 Altamont Cir Los Altos, CA 94022
Estimated Value: $4,288,000 - $4,869,000
4
Beds
3
Baths
3,220
Sq Ft
$1,411/Sq Ft
Est. Value
About This Home
This home is located at 27866 Altamont Cir, Los Altos, CA 94022 and is currently estimated at $4,542,692, approximately $1,410 per square foot. 27866 Altamont Cir is a home located in Santa Clara County with nearby schools including Gardner Bullis Elementary School, Ardis G. Egan Junior High School, and Los Altos High School.
Ownership History
Date
Name
Owned For
Owner Type
Purchase Details
Closed on
Jan 23, 2007
Sold by
Chung Wing Kuen and Chung Yufeng H
Bought by
Chung Wing Kuen and Chung Yufeng Han
Current Estimated Value
Purchase Details
Closed on
Feb 23, 2000
Sold by
Cooper Ted and Cooper Jennifer S
Bought by
Chung Wing Kuen and Chung Yufeng H
Home Financials for this Owner
Home Financials are based on the most recent Mortgage that was taken out on this home.
Original Mortgage
$800,000
Outstanding Balance
$258,854
Interest Rate
7.87%
Estimated Equity
$4,283,838
Purchase Details
Closed on
Sep 7, 1999
Sold by
Fisher Kenneth A and Lane Carol S
Bought by
Cooper Ted and Cooper Jennifer S
Home Financials for this Owner
Home Financials are based on the most recent Mortgage that was taken out on this home.
Original Mortgage
$962,500
Interest Rate
8.87%
Purchase Details
Closed on
Sep 25, 1995
Sold by
The First National Bank Of Chicago
Bought by
Fisher Kenneth A and Lane Carol S
Home Financials for this Owner
Home Financials are based on the most recent Mortgage that was taken out on this home.
Original Mortgage
$559,200
Interest Rate
7.97%
Create a Home Valuation Report for This Property
The Home Valuation Report is an in-depth analysis detailing your home's value as well as a comparison with similar homes in the area
Home Values in the Area
Average Home Value in this Area
Purchase History
| Date | Buyer | Sale Price | Title Company |
|---|---|---|---|
| Chung Wing Kuen | -- | None Available | |
| Chung Wing Kuen | $1,670,000 | First American Title Guarant | |
| Cooper Ted | $1,375,000 | First American Title Co | |
| Fisher Kenneth A | $699,000 | Chicago Title Co |
Source: Public Records
Mortgage History
| Date | Status | Borrower | Loan Amount |
|---|---|---|---|
| Open | Chung Wing Kuen | $800,000 | |
| Previous Owner | Cooper Ted | $962,500 | |
| Previous Owner | Fisher Kenneth A | $559,200 | |
| Closed | Cooper Ted | $137,500 |
Source: Public Records
Tax History Compared to Growth
Tax History
| Year | Tax Paid | Tax Assessment Tax Assessment Total Assessment is a certain percentage of the fair market value that is determined by local assessors to be the total taxable value of land and additions on the property. | Land | Improvement |
|---|---|---|---|---|
| 2025 | $29,447 | $2,562,140 | $1,536,979 | $1,025,161 |
| 2024 | $29,447 | $2,511,903 | $1,506,843 | $1,005,060 |
| 2023 | $28,974 | $2,462,651 | $1,477,298 | $985,353 |
| 2022 | $28,651 | $2,414,365 | $1,448,332 | $966,033 |
| 2021 | $28,791 | $2,367,026 | $1,419,934 | $947,092 |
| 2020 | $29,027 | $2,342,756 | $1,405,375 | $937,381 |
| 2019 | $27,603 | $2,296,820 | $1,377,819 | $919,001 |
| 2018 | $27,305 | $2,251,785 | $1,350,803 | $900,982 |
| 2017 | $26,252 | $2,207,633 | $1,324,317 | $883,316 |
| 2016 | $25,566 | $2,164,347 | $1,298,350 | $865,997 |
| 2015 | $25,181 | $2,131,837 | $1,278,848 | $852,989 |
| 2014 | $24,897 | $2,090,079 | $1,253,798 | $836,281 |
Source: Public Records
Map
Nearby Homes
- 3875 Page Mill Rd
- 27464 Altamont Rd
- 28140 Story Hill Ln
- 27690 Briones Ct
- 28500 Matadero Creek Ln
- 27388 Sherlock Ct
- 976 Laurel Glen Dr
- 2987 Alexis Dr
- 27000 Almaden Ct
- 28025 Natoma Rd
- 27500 La Vida Real
- 13050 Cumbra Vista Ct
- 640 Los Trancos Rd
- 12750 Canario Way
- 0 Arroyo Way Unit ML81991983
- 12675 La Cresta Dr
- 14449 Liddicoat Cir
- 3875 Page Mill Rd
- 21 Valley Oak St
- 20 Bear Gulch Dr
- 27857 Altamont Cir
- 27815 Altamont Cir
- 27870 Altamont Cir
- 27800 Altamont Cir
- 27900 Altamont Cir
- 27901 Altamont Cir
- 27775 Altamont Cir
- 27869 Altamont Cir
- 27778 Altamont Cir
- 27902 Altamont Cir
- 27935 Altamont Cir
- 27750 Altamont Cir
- 27924 Altamont Cir
- 27985 Central Dr
- 27930 Altamont Cir
- 27938 Altamont Cir
- 27718 Altamont Cir
- 27749 Altamont Cir
- 27983 Central Dr
- 11800 Page Mill Rd