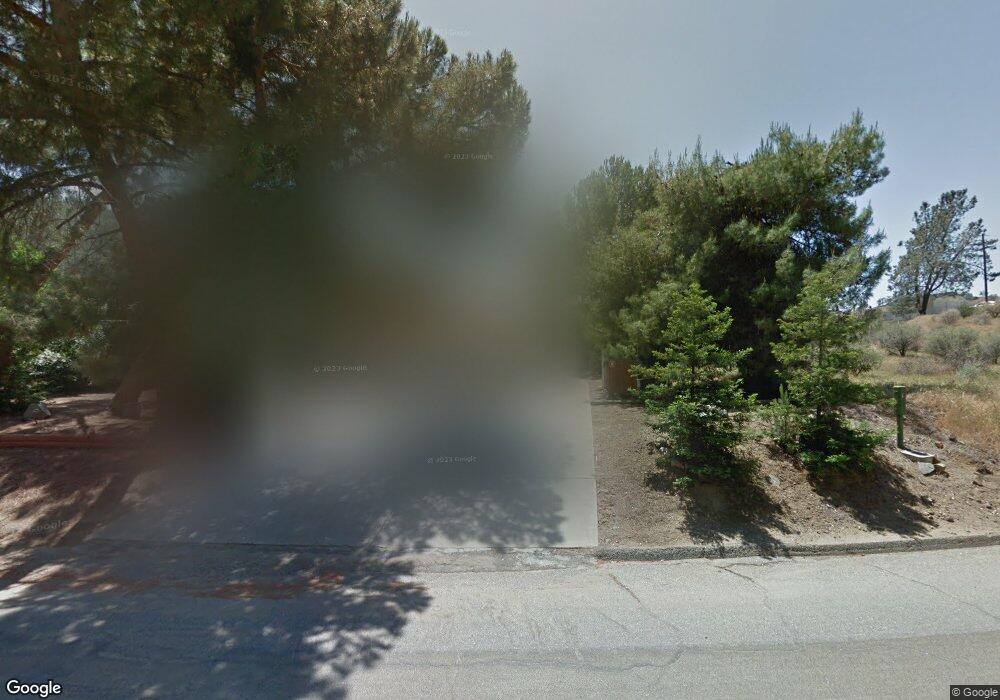
27875 Sky Harbour Rd Friant, CA 93626
Estimated Value: $350,425 - $524,000
3
Beds
3
Baths
2,050
Sq Ft
$223/Sq Ft
Est. Value
About This Home
This home is located at 27875 Sky Harbour Rd, Friant, CA 93626 and is currently estimated at $456,356, approximately $222 per square foot. 27875 Sky Harbour Rd is a home located in Fresno County with nearby schools including Foothill Elementary, Sierra Junior High, and Sierra High School.
Ownership History
Date
Name
Owned For
Owner Type
Purchase Details
Closed on
May 27, 2008
Sold by
Federal Home Loan Mortgage Corporation
Bought by
Mcquoid Darren and Mcquoid Kobie
Current Estimated Value
Home Financials for this Owner
Home Financials are based on the most recent Mortgage that was taken out on this home.
Original Mortgage
$180,000
Interest Rate
6.05%
Mortgage Type
Purchase Money Mortgage
Purchase Details
Closed on
Nov 29, 2007
Sold by
Stevens Craig R and Stevens Lynette K
Bought by
Federal Home Loan Mortgage Corporation
Purchase Details
Closed on
Mar 6, 2003
Sold by
Herbeck Walter O and Kosich Enko Svetlana
Bought by
Stevens Craig R and Stevens Lynette K
Home Financials for this Owner
Home Financials are based on the most recent Mortgage that was taken out on this home.
Original Mortgage
$166,500
Interest Rate
5.72%
Purchase Details
Closed on
Oct 12, 2001
Sold by
Herbeck Walter O
Bought by
Herbeck Walter O and Kosich Enko Svetlana
Create a Home Valuation Report for This Property
The Home Valuation Report is an in-depth analysis detailing your home's value as well as a comparison with similar homes in the area
Home Values in the Area
Average Home Value in this Area
Purchase History
| Date | Buyer | Sale Price | Title Company |
|---|---|---|---|
| Mcquoid Darren | $225,000 | Chicago Title | |
| Federal Home Loan Mortgage Corporation | $239,676 | Landsafe Title | |
| Stevens Craig R | $210,000 | Fidelity National Title Co | |
| Herbeck Walter O | -- | -- | |
| Herbeck Walter O | -- | -- |
Source: Public Records
Mortgage History
| Date | Status | Borrower | Loan Amount |
|---|---|---|---|
| Previous Owner | Mcquoid Darren | $180,000 | |
| Previous Owner | Stevens Craig R | $166,500 |
Source: Public Records
Tax History Compared to Growth
Tax History
| Year | Tax Paid | Tax Assessment Tax Assessment Total Assessment is a certain percentage of the fair market value that is determined by local assessors to be the total taxable value of land and additions on the property. | Land | Improvement |
|---|---|---|---|---|
| 2025 | $3,085 | $295,525 | $111,642 | $183,883 |
| 2023 | $3,028 | $284,051 | $107,307 | $176,744 |
| 2022 | $2,992 | $278,482 | $105,203 | $173,279 |
| 2021 | $2,908 | $273,023 | $103,141 | $169,882 |
| 2020 | $2,900 | $270,225 | $102,084 | $168,141 |
| 2019 | $2,846 | $264,928 | $100,083 | $164,845 |
| 2018 | $2,785 | $259,734 | $98,121 | $161,613 |
| 2017 | $2,741 | $254,643 | $96,198 | $158,445 |
| 2016 | $2,203 | $205,588 | $77,565 | $128,023 |
| 2015 | $2,171 | $202,500 | $76,400 | $126,100 |
| 2014 | $2,076 | $192,900 | $72,800 | $120,100 |
Source: Public Records
Map
Nearby Homes
- 27767 Sky Harbour Rd
- 27757 Sky Harbour Rd
- 27669 Sky Harbour Rd
- 28277 Sky Harbour Rd
- 0 El Lado Rd
- 28589 Sky Harbour Rd
- 28762 Sky Harbour Rd
- 28763 Sky Harbour Rd
- 0 No Address Available Unit 616829
- 0 No Address Available Unit 616827
- 20515 Galileo Ct
- 20615 Galileo Ct
- 28075 Sky Harbour Rd
- 28595 Sky Harbour Rd
- 0 Sky Harbour Rd Unit 636574
- 0 Flint Dr Unit ND25118961
- 9999 Balboa Ct
- 49351 Ralston Ridge
- 102 Hidden Lake Blvd
- 1 the Preserve at Millerton Lake
- 27853 Sky Harbour Rd
- 27907 Sky Harbour Rd
- 27925 Sky Harbour Rd
- 27827 Sky Harbour Rd
- 27935 Sky Harbour Rd
- 28103 Sky Lake Dr
- 27817 Sky Harbour Rd
- 28057 Sky Lake Dr
- 28047 Sky Lake Dr
- 28027 Sky Lake Dr
- 27943 Sky Harbour Rd
- 27840 Sky Harbour Rd
- 27830 Sky Harbour Rd
- 27999 Sky Lake Dr
- 27801 Sky Harbour Rd
- 28113 Sky Lake Dr Unit 166
- 28113 Sky Lake Dr
- 27951 Sky Harbour Rd
- 27802 Sky Harbour Rd
- 28124 Sky Lake Dr Unit 165