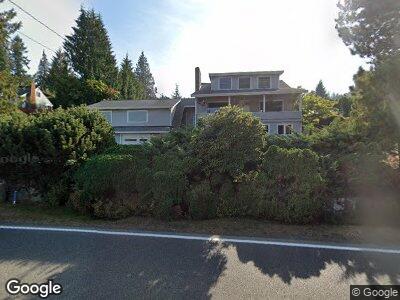
2789 Lake Whatcom Blvd Bellingham, WA 98229
Estimated Value: $954,000 - $1,325,696
4
Beds
4
Baths
3,300
Sq Ft
$353/Sq Ft
Est. Value
About This Home
This home is located at 2789 Lake Whatcom Blvd, Bellingham, WA 98229 and is currently estimated at $1,165,924, approximately $353 per square foot. 2789 Lake Whatcom Blvd is a home located in Whatcom County with nearby schools including Geneva Elementary School, Kulshan Middle School, and Bellingham High School.
Create a Home Valuation Report for This Property
The Home Valuation Report is an in-depth analysis detailing your home's value as well as a comparison with similar homes in the area
Home Values in the Area
Average Home Value in this Area
Mortgage History
| Date | Status | Borrower | Loan Amount |
|---|---|---|---|
| Closed | Caven Brian A | $124,000 | |
| Closed | Caven Brian A | $140,000 |
Source: Public Records
Tax History Compared to Growth
Tax History
| Year | Tax Paid | Tax Assessment Tax Assessment Total Assessment is a certain percentage of the fair market value that is determined by local assessors to be the total taxable value of land and additions on the property. | Land | Improvement |
|---|---|---|---|---|
| 2024 | $10,755 | $1,235,491 | $757,142 | $478,349 |
| 2023 | $10,755 | $1,266,947 | $776,419 | $490,528 |
| 2022 | $8,990 | $1,073,705 | $657,995 | $415,710 |
| 2021 | $8,460 | $838,831 | $514,058 | $324,773 |
| 2020 | $6,295 | $776,696 | $475,980 | $300,716 |
| 2019 | $5,857 | $563,221 | $356,650 | $206,571 |
| 2018 | $5,917 | $532,060 | $337,035 | $195,025 |
| 2017 | $5,165 | $457,924 | $289,658 | $168,266 |
| 2016 | $4,612 | $416,609 | $263,391 | $153,218 |
| 2015 | -- | $389,493 | $248,450 | $141,043 |
Source: Public Records
Map
Nearby Homes
- 2781 Lake Whatcom Blvd
- 4926 Fremont St
- 1016 Coronado Ave
- 911 Coronado Ave
- 4964 Lewis Ave
- 4705 Austin Ct
- 1217 Geneva St
- 1538 Fairview St
- 989 Lakewood Ln
- 1558 Fairview St
- 1555 Fairview St
- 2688 Strawberry Shore Dr
- 1933 Valleybrook Ln
- 2141 Northshore Rd
- 1209 Euclid Ave
- 4130 Lakeway Dr
- 2247 Northshore Rd
- 1348 Parkstone Ln
- 3178 Edgewood Ln
- 1824 Lakeside Ave
- 2789 Lake Whatcom Blvd
- 4952 Lasalle Ave
- 2795 Lake Whatcom Blvd
- 2787 Lake Whatcom Blvd
- 4950 Lasalle Ave
- 4945 Lasalle Ave
- 823 Moonstone Ln Unit 1
- 823 Moonstone Ln
- 2797 Lake Whatcom Blvd
- 817 Moonstone Ln
- 2790 Lake Whatcom Blvd
- 4935 Lasalle Ave
- 0 Moonstone Ln
- 4944 Lasalle Ave
- 4982 Fremont St
- 811 Moonstone Ln
- 2809 Lake Whatcom Blvd
- 4946 Lasalle Ave
- 2777 Lake Whatcom Blvd
- 4927 Lasalle Ave