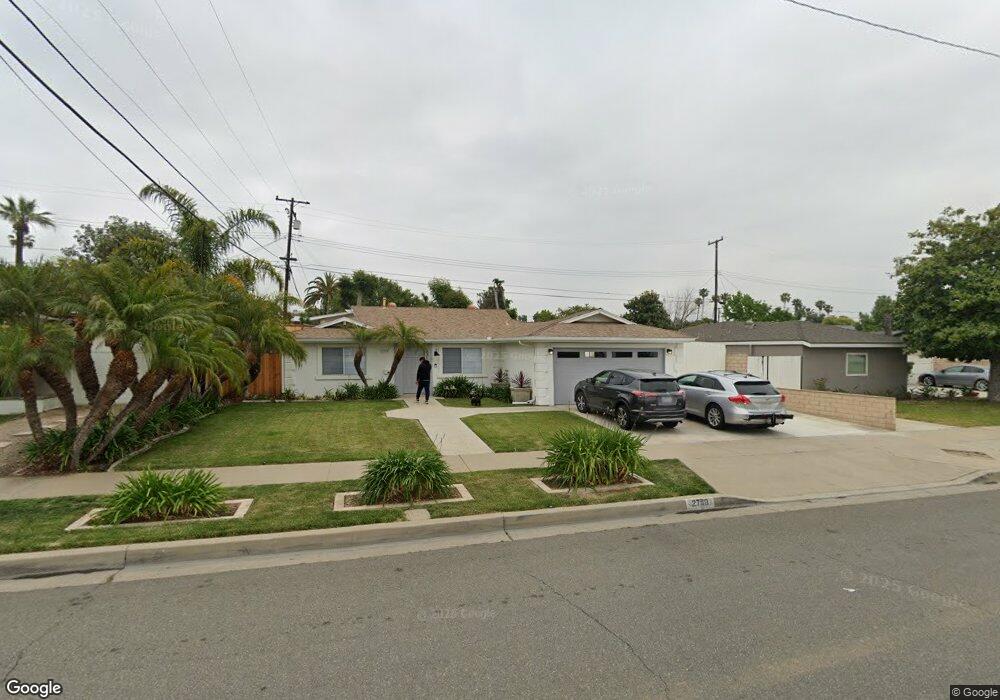
2789 N Anchor St Orange, CA 92865
Estimated Value: $1,019,000 - $1,099,491
3
Beds
2
Baths
1,183
Sq Ft
$886/Sq Ft
Est. Value
About This Home
This home is located at 2789 N Anchor St, Orange, CA 92865 and is currently estimated at $1,048,623, approximately $886 per square foot. 2789 N Anchor St is a home located in Orange County with nearby schools including Olive Elementary School, Cerro Villa Middle School, and Villa Park High School.
Ownership History
Date
Name
Owned For
Owner Type
Purchase Details
Closed on
Nov 22, 2024
Sold by
Jack F Seeley Trust and Seeley Wendy
Bought by
Year Kennedy and Gonzalez Priscilla
Current Estimated Value
Home Financials for this Owner
Home Financials are based on the most recent Mortgage that was taken out on this home.
Original Mortgage
$832,000
Outstanding Balance
$824,709
Interest Rate
6.79%
Mortgage Type
New Conventional
Estimated Equity
$223,914
Purchase Details
Closed on
Jul 21, 1999
Sold by
Seeley Jack F
Bought by
Seeley Jack F and The Jack F Seeley Trust
Create a Home Valuation Report for This Property
The Home Valuation Report is an in-depth analysis detailing your home's value as well as a comparison with similar homes in the area
Home Values in the Area
Average Home Value in this Area
Purchase History
We collect this data history from publicly available records. To have your information removed, we recommend requesting removal directly through your county’s website.
| Date | Buyer | Sale Price | Title Company |
|---|---|---|---|
| Year Kennedy | $1,040,000 | Chicago Title Company | |
| Kennedy Year | $1,040,000 | Chicago Title Company | |
| Seeley Jack F | -- | -- |
Source: Public Records
Mortgage History
We collect this data history from publicly available records. To have your information removed, we recommend requesting removal directly through your county’s website.
| Date | Status | Borrower | Loan Amount |
|---|---|---|---|
| Open | Kennedy Year | $832,000 | |
| Closed | Year Kennedy | $832,000 |
Source: Public Records
Tax History
| Year | Tax Paid | Tax Assessment Tax Assessment Total Assessment is a certain percentage of the fair market value that is determined by local assessors to be the total taxable value of land and additions on the property. | Land | Improvement |
|---|---|---|---|---|
| 2025 | $1,235 | $1,040,000 | $880,000 | $160,000 |
| 2024 | $1,235 | $79,714 | $37,646 | $42,068 |
| 2023 | $1,203 | $78,151 | $36,907 | $41,244 |
| 2022 | $1,177 | $76,619 | $36,183 | $40,436 |
| 2021 | $1,149 | $75,117 | $35,473 | $39,644 |
| 2020 | $1,138 | $74,347 | $35,109 | $39,238 |
| 2019 | $1,127 | $72,890 | $34,421 | $38,469 |
| 2018 | $1,111 | $71,461 | $33,746 | $37,715 |
| 2017 | $1,074 | $70,060 | $33,084 | $36,976 |
| 2016 | $1,056 | $68,687 | $32,436 | $36,251 |
| 2015 | $1,040 | $67,656 | $31,949 | $35,707 |
| 2014 | $1,018 | $66,331 | $31,323 | $35,008 |
Source: Public Records
Map
Nearby Homes
- 2620 N Dunbar St
- 1131 E Saint James Ave
- 1403 E Sail Ave
- 2506 N Lisa Place
- 16780 E Buena Vista Ave
- 3036 N Skywood St
- 3158 N Beechwood St
- 2850 N Glassell St
- 840 E Glendora Ave
- 3059 N Butterfield Rd
- 2433 N Cameo Ct
- 3180 N Hartman St
- 3132 N Westhaven St
- 250 W Sparkleberry Ave
- 709 E Meadowbrook Ave
- 3028 Juneberry St
- 506 W Linden Dr
- 1800 E Heim Ave Unit 48
- 1800 E Heim Ave Unit 29
- 2035 E Orangeview Ln
- 908 E Whitecap Ave
- 2748 N Anchor St
- 848 E Whitecap Ave
- 2749 N Swell St
- 2738 N Anchor St
- 2786 N Anchor St
- 901 E Whitecap Ave
- 2765 N Anchor St
- 2753 N Anchor St
- 2777 N Anchor St
- 2777 N Anchor Ave
- 845 E Whitecap Ave
- 2741 N Anchor St
- 2737 N Swell St
- 2728 N Anchor St
- 2796 N Anchor St
- 2789 N Anchor Ave
- 833 E Whitecap Ave
- 2731 N Anchor St
- 824 E Whitecap Ave
Your Personal Tour Guide
Ask me questions while you tour the home.