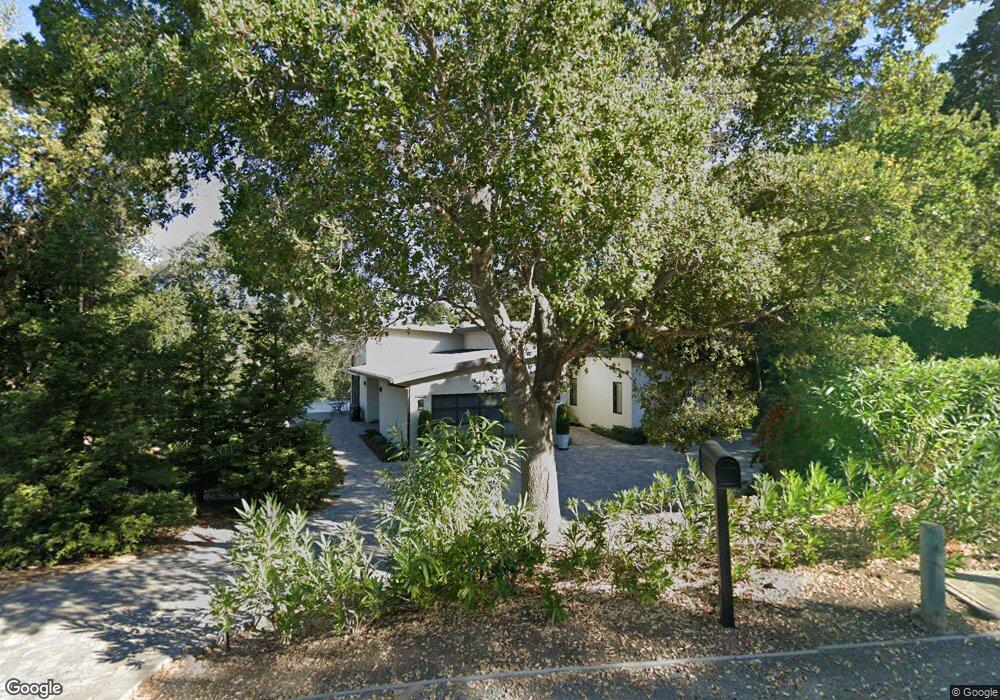
27899 Via Ventana Way Los Altos Hills, CA 94022
Estimated Value: $4,375,868 - $5,450,000
4
Beds
2
Baths
2,401
Sq Ft
$2,018/Sq Ft
Est. Value
About This Home
This home is located at 27899 Via Ventana Way, Los Altos Hills, CA 94022 and is currently estimated at $4,845,623, approximately $2,018 per square foot. 27899 Via Ventana Way is a home located in Santa Clara County with nearby schools including Lucille M. Nixon Elementary School, Ellen Fletcher Middle, and Henry M. Gunn High School.
Ownership History
Date
Name
Owned For
Owner Type
Purchase Details
Closed on
Apr 29, 2013
Sold by
Pradzynski Krzysztof and Wolodkowicz Wanda
Bought by
Pradzynski Krzysztof and Wolodkowicz Wanda
Current Estimated Value
Purchase Details
Closed on
Aug 1, 2011
Sold by
Schultz Mary Louise
Bought by
Pradzynski Krzysztof and Wolodkowicz Wanda
Home Financials for this Owner
Home Financials are based on the most recent Mortgage that was taken out on this home.
Original Mortgage
$1,000,000
Outstanding Balance
$644,859
Interest Rate
3.15%
Mortgage Type
Adjustable Rate Mortgage/ARM
Estimated Equity
$4,200,764
Purchase Details
Closed on
Apr 23, 2007
Sold by
Schultz Mary Louise
Bought by
Schultz Mary Louise and Abbott Mark Richard
Purchase Details
Closed on
Apr 17, 2000
Sold by
Abbott Pearl H
Bought by
Schultz Mary Louise
Purchase Details
Closed on
Oct 2, 1997
Sold by
Abbott Pearl H and Abbott Louise Mary
Bought by
Abbott Pearl H and Schultz Mary Louise
Create a Home Valuation Report for This Property
The Home Valuation Report is an in-depth analysis detailing your home's value as well as a comparison with similar homes in the area
Home Values in the Area
Average Home Value in this Area
Purchase History
| Date | Buyer | Sale Price | Title Company |
|---|---|---|---|
| Pradzynski Krzysztof | -- | None Available | |
| Pradzynski Krzysztof | $1,900,000 | Cornerstone Title Company | |
| Schultz Mary Louise | -- | None Available | |
| Schultz Mary Louise | -- | -- | |
| Abbott Pearl H | -- | -- | |
| Abbott Pearl H | -- | -- |
Source: Public Records
Mortgage History
| Date | Status | Borrower | Loan Amount |
|---|---|---|---|
| Open | Pradzynski Krzysztof | $1,000,000 |
Source: Public Records
Tax History Compared to Growth
Tax History
| Year | Tax Paid | Tax Assessment Tax Assessment Total Assessment is a certain percentage of the fair market value that is determined by local assessors to be the total taxable value of land and additions on the property. | Land | Improvement |
|---|---|---|---|---|
| 2025 | $33,930 | $2,780,195 | $2,009,685 | $770,510 |
| 2024 | $33,930 | $2,725,682 | $1,970,280 | $755,402 |
| 2023 | $33,427 | $2,672,239 | $1,931,648 | $740,591 |
| 2022 | $33,072 | $2,619,843 | $1,893,773 | $726,070 |
| 2021 | $32,358 | $2,568,475 | $1,856,641 | $711,834 |
| 2020 | $31,698 | $2,542,140 | $1,837,604 | $704,536 |
| 2019 | $31,346 | $2,492,295 | $1,801,573 | $690,722 |
| 2018 | $31,265 | $2,443,428 | $1,766,249 | $677,179 |
| 2017 | $30,687 | $2,395,518 | $1,731,617 | $663,901 |
| 2016 | $29,925 | $2,348,548 | $1,697,664 | $650,884 |
| 2015 | $29,779 | $2,313,272 | $1,672,164 | $641,108 |
| 2014 | $23,935 | $1,951,023 | $1,639,409 | $311,614 |
Source: Public Records
Map
Nearby Homes
- 28500 Matadero Creek Ln
- 28140 Story Hill Ln
- 27690 Briones Ct
- 27464 Altamont Rd
- 2987 Alexis Dr
- 3875 Page Mill Rd
- 28025 Natoma Rd
- 976 Laurel Glen Dr
- 27388 Sherlock Ct
- 27000 Almaden Ct
- 27500 La Vida Real
- 13050 Cumbra Vista Ct
- 12750 Canario Way
- 12675 La Cresta Dr
- 14449 Liddicoat Cir
- 12668 La Cresta Ct
- 0 Arroyo Way Unit ML81991983
- 640 Los Trancos Rd
- 25751 Elena Rd
- 13456 Mandoli Dr
- 27855 Via Ventana Way
- 27911 Via Ventana Way
- 27789 Via Ventana Way
- 27888 Via Ventana Way
- 27807 Via Ventana Way
- 27900 Via Ventana Way
- 27876 Via Ventana Way
- 27882 Via Ventana Way
- 27765 Via Ventana Way
- 27933 Via Ventana Way
- 27955 Briones Way
- 27990 Via Ventana Way
- 27798 Via Ventana Way
- 27886 Via Ventana Way
- 27718 Via Ventana Way
- 27743 Via Ventana Way
- 12538 Briones Way
- 12545 Briones Way
- 27957 Via Ventana Way