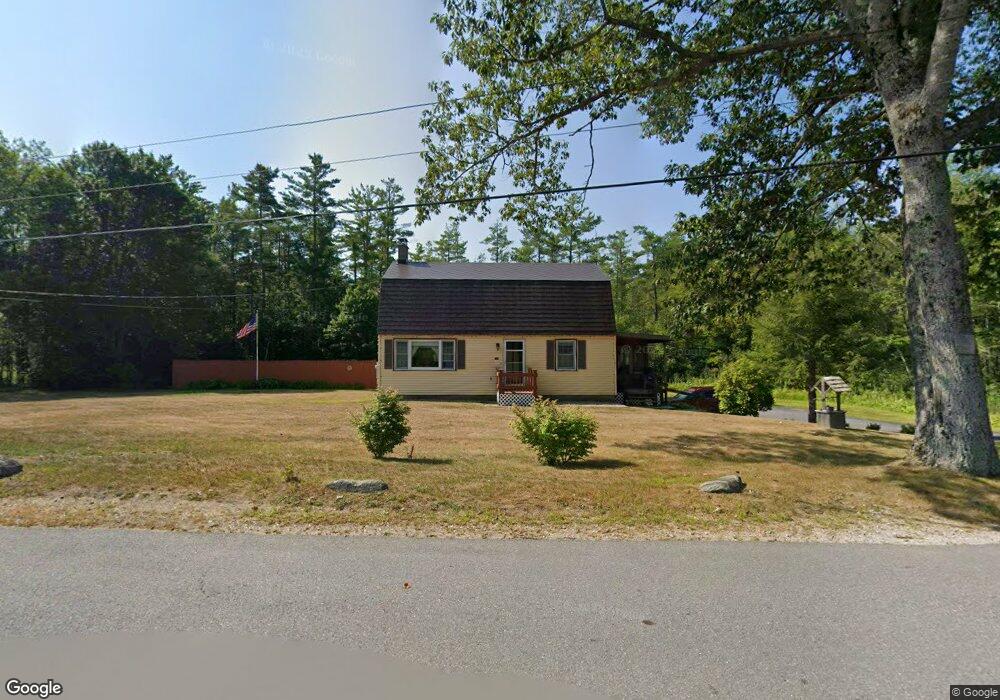
279 Abel Rd Rindge, NH 03461
Estimated Value: $398,000 - $541,000
3
Beds
2
Baths
2,275
Sq Ft
$207/Sq Ft
Est. Value
About This Home
This home is located at 279 Abel Rd, Rindge, NH 03461 and is currently estimated at $470,359, approximately $206 per square foot. 279 Abel Rd is a home located in Cheshire County with nearby schools including Rindge Memorial School, Conant Middle High School, and Conant High School.
Ownership History
Date
Name
Owned For
Owner Type
Purchase Details
Closed on
Jun 21, 1985
Bought by
Miller Albert J and Miller Mary L
Current Estimated Value
Create a Home Valuation Report for This Property
The Home Valuation Report is an in-depth analysis detailing your home's value as well as a comparison with similar homes in the area
Home Values in the Area
Average Home Value in this Area
Purchase History
| Date | Buyer | Sale Price | Title Company |
|---|---|---|---|
| Miller Albert J | -- | -- |
Source: Public Records
Mortgage History
| Date | Status | Borrower | Loan Amount |
|---|---|---|---|
| Open | Miller Albert J | $51,750 |
Source: Public Records
Tax History Compared to Growth
Tax History
| Year | Tax Paid | Tax Assessment Tax Assessment Total Assessment is a certain percentage of the fair market value that is determined by local assessors to be the total taxable value of land and additions on the property. | Land | Improvement |
|---|---|---|---|---|
| 2024 | $5,753 | $227,300 | $45,400 | $181,900 |
| 2023 | $5,692 | $227,300 | $45,400 | $181,900 |
| 2022 | $5,269 | $228,800 | $45,400 | $183,400 |
| 2021 | $5,182 | $228,800 | $45,400 | $183,400 |
| 2020 | $5,137 | $228,800 | $45,400 | $183,400 |
| 2019 | $4,428 | $159,500 | $37,400 | $122,100 |
| 2018 | $4,386 | $159,500 | $37,400 | $122,100 |
| 2017 | $4,337 | $159,500 | $37,400 | $122,100 |
| 2016 | $4,452 | $159,500 | $37,400 | $122,100 |
| 2015 | $4,448 | $159,500 | $37,400 | $122,100 |
| 2014 | $4,357 | $167,400 | $62,000 | $105,400 |
| 2013 | $4,394 | $172,600 | $62,000 | $110,600 |
Source: Public Records
Map
Nearby Homes
- 628 Fullam Hill Rd
- 801 Rt 12 S
- 26 Weidner Dr
- 69 Camp Cir
- 45 Camp Cir
- 257 Lakeside Dr
- 74 Fern Cir
- 240 Pine Tree Ln
- 60 Fern Cir Unit 1-59
- 115 Brook Side Rd Unit 2-12
- 22 Daria Dr
- 47 Old Military Rd
- 25 S Pond Rd
- 0 Thomas Rd Unit 10 5014817
- 37 Willow Ln
- 00 Fullam Hill Rd Unit 5, 6, 50
- 31 Willow Ln
- 43 Willow Ln
- 39 Willow Ln
- 41 Willow Ln