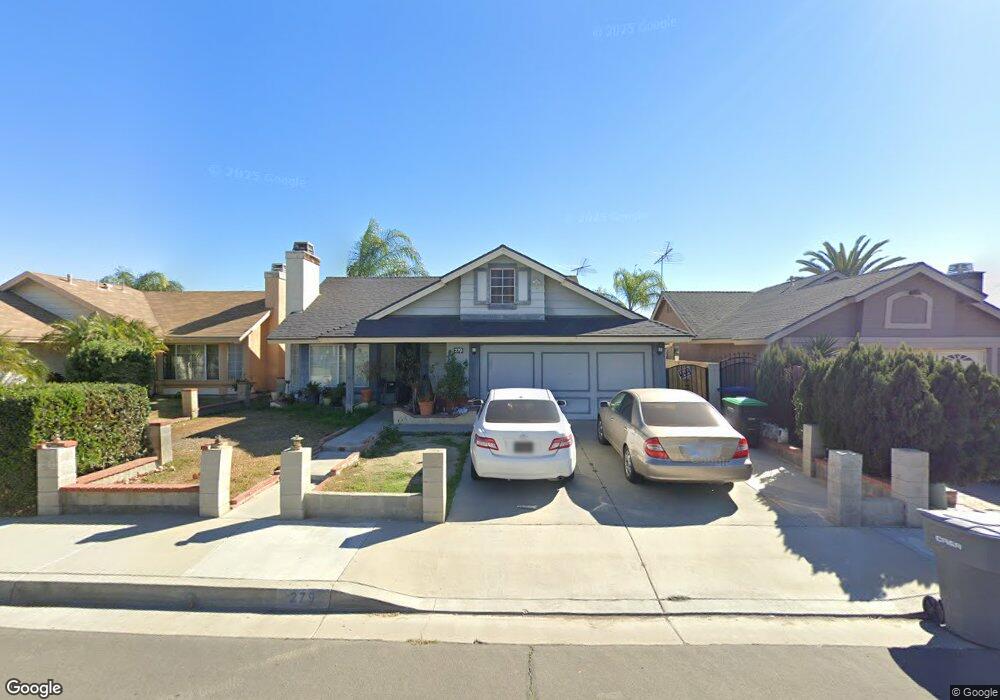
279 Chant St Perris, CA 92571
Central Perris NeighborhoodEstimated Value: $421,257 - $452,000
2
Beds
1
Bath
932
Sq Ft
$474/Sq Ft
Est. Value
About This Home
This home is located at 279 Chant St, Perris, CA 92571 and is currently estimated at $442,064, approximately $474 per square foot. 279 Chant St is a home located in Riverside County with nearby schools including Val Verde Elementary School, Lakeside Middle School, and Rancho Verde High School.
Ownership History
Date
Name
Owned For
Owner Type
Purchase Details
Closed on
May 6, 2003
Sold by
Hud
Bought by
Gallegos Miguel
Current Estimated Value
Home Financials for this Owner
Home Financials are based on the most recent Mortgage that was taken out on this home.
Original Mortgage
$120,000
Outstanding Balance
$51,051
Interest Rate
5.5%
Mortgage Type
Purchase Money Mortgage
Estimated Equity
$391,013
Purchase Details
Closed on
Jan 30, 2003
Sold by
Citimortgage Inc
Bought by
Hud
Purchase Details
Closed on
Feb 27, 2002
Sold by
Arnold Peter
Bought by
Citimortgage Inc
Purchase Details
Closed on
Jan 11, 2000
Sold by
Frigo James D and Frigo Christina M
Bought by
Arnold Peter
Home Financials for this Owner
Home Financials are based on the most recent Mortgage that was taken out on this home.
Original Mortgage
$71,889
Interest Rate
7.96%
Mortgage Type
FHA
Create a Home Valuation Report for This Property
The Home Valuation Report is an in-depth analysis detailing your home's value as well as a comparison with similar homes in the area
Home Values in the Area
Average Home Value in this Area
Purchase History
| Date | Buyer | Sale Price | Title Company |
|---|---|---|---|
| Gallegos Miguel | $120,000 | First American Title Co | |
| Hud | -- | Fidelity | |
| Citimortgage Inc | $81,403 | First American Title Co | |
| Arnold Peter | $72,000 | American Title |
Source: Public Records
Mortgage History
| Date | Status | Borrower | Loan Amount |
|---|---|---|---|
| Open | Gallegos Miguel | $120,000 | |
| Previous Owner | Arnold Peter | $71,889 |
Source: Public Records
Tax History
| Year | Tax Paid | Tax Assessment Tax Assessment Total Assessment is a certain percentage of the fair market value that is determined by local assessors to be the total taxable value of land and additions on the property. | Land | Improvement |
|---|---|---|---|---|
| 2025 | $2,165 | $173,767 | $65,157 | $108,610 |
| 2023 | $2,165 | $167,022 | $62,628 | $104,394 |
| 2022 | $2,106 | $163,748 | $61,400 | $102,348 |
| 2021 | $2,092 | $160,539 | $60,197 | $100,342 |
| 2020 | $2,073 | $158,894 | $59,580 | $99,314 |
| 2019 | $1,961 | $155,779 | $58,412 | $97,367 |
| 2018 | $1,936 | $152,725 | $57,268 | $95,457 |
| 2017 | $2,685 | $149,732 | $56,146 | $93,586 |
| 2016 | $2,737 | $146,797 | $55,046 | $91,751 |
| 2015 | $2,713 | $144,594 | $54,220 | $90,374 |
| 2014 | $2,738 | $141,763 | $53,159 | $88,604 |
Source: Public Records
Map
Nearby Homes
- 2607 Ferdinand Ct
- 0 Redlands Ave Unit SW26063801
- 2536 Slew of Gold Ct
- 49 Bold Venture St
- 166 Ambrosia Ct
- 2269 Firebrand Ave
- 575 Prairie Way
- 716 Periwinkle Ln
- 26625 Placentia Ave
- 2248 Ridge Ct
- 705 Fuchsia Ln
- 723 Anthirium Ave
- 377 Aurora Dr
- 2036 Cherrytree Dr
- 2293 Murrieta Rd
- 763 Anthirium Ave
- 560 Coudures Way
- 1942 Sandcastle Dr
- 2143 Willowbrook Ln
- 1900 Summertree Dr
Your Personal Tour Guide
Ask me questions while you tour the home.