279 Desert Falls Dr E Unit 11 Palm Desert, CA 92211
Desert Falls NeighborhoodEstimated Value: $466,000 - $556,000
3
Beds
3
Baths
1,814
Sq Ft
$281/Sq Ft
Est. Value
About This Home
This home is located at 279 Desert Falls Dr E Unit 11, Palm Desert, CA 92211 and is currently estimated at $510,009, approximately $281 per square foot. 279 Desert Falls Dr E Unit 11 is a home located in Riverside County with nearby schools including James Earl Carter Elementary School, Colonel Mitchell Paige Middle School, and Palm Desert High School.
Ownership History
Date
Name
Owned For
Owner Type
Purchase Details
Closed on
Aug 25, 2008
Sold by
Tjerrild Julie and Baranyk Julie
Bought by
Hardy Kenneth W and Hardy Joy K
Current Estimated Value
Home Financials for this Owner
Home Financials are based on the most recent Mortgage that was taken out on this home.
Original Mortgage
$242,400
Interest Rate
6.39%
Mortgage Type
Purchase Money Mortgage
Purchase Details
Closed on
Nov 14, 2006
Sold by
Baranyk Donald G
Bought by
Baranyk Julie A
Purchase Details
Closed on
May 10, 2005
Sold by
Bratton Robert W and Bratton Aileen M
Bought by
Baranyk Donald G and Baranyk Julie A
Purchase Details
Closed on
Mar 27, 1998
Sold by
Raiden Norman H and Raiden Eilene J
Bought by
Bratton Robert W and Bratton Eileen M
Create a Home Valuation Report for This Property
The Home Valuation Report is an in-depth analysis detailing your home's value as well as a comparison with similar homes in the area
Home Values in the Area
Average Home Value in this Area
Purchase History
| Date | Buyer | Sale Price | Title Company |
|---|---|---|---|
| Hardy Kenneth W | $303,000 | Chicago Title | |
| Baranyk Julie A | -- | None Available | |
| Baranyk Donald G | $415,000 | Chicago Title | |
| Bratton Robert W | $178,000 | Orange Coast Title Co |
Source: Public Records
Mortgage History
| Date | Status | Borrower | Loan Amount |
|---|---|---|---|
| Previous Owner | Hardy Kenneth W | $242,400 |
Source: Public Records
Tax History Compared to Growth
Tax History
| Year | Tax Paid | Tax Assessment Tax Assessment Total Assessment is a certain percentage of the fair market value that is determined by local assessors to be the total taxable value of land and additions on the property. | Land | Improvement |
|---|---|---|---|---|
| 2025 | $5,217 | $378,098 | $117,046 | $261,052 |
| 2023 | $5,217 | $363,417 | $112,501 | $250,916 |
| 2022 | $4,901 | $356,293 | $110,296 | $245,997 |
| 2021 | $4,770 | $349,308 | $108,134 | $241,174 |
| 2020 | $4,688 | $345,728 | $107,026 | $238,702 |
| 2019 | $4,604 | $338,950 | $104,928 | $234,022 |
| 2018 | $4,522 | $332,305 | $102,872 | $229,433 |
| 2017 | $4,433 | $325,790 | $100,855 | $224,935 |
| 2016 | $4,328 | $319,403 | $98,878 | $220,525 |
| 2015 | $4,338 | $314,607 | $97,394 | $217,213 |
| 2014 | $4,167 | $308,446 | $95,487 | $212,959 |
Source: Public Records
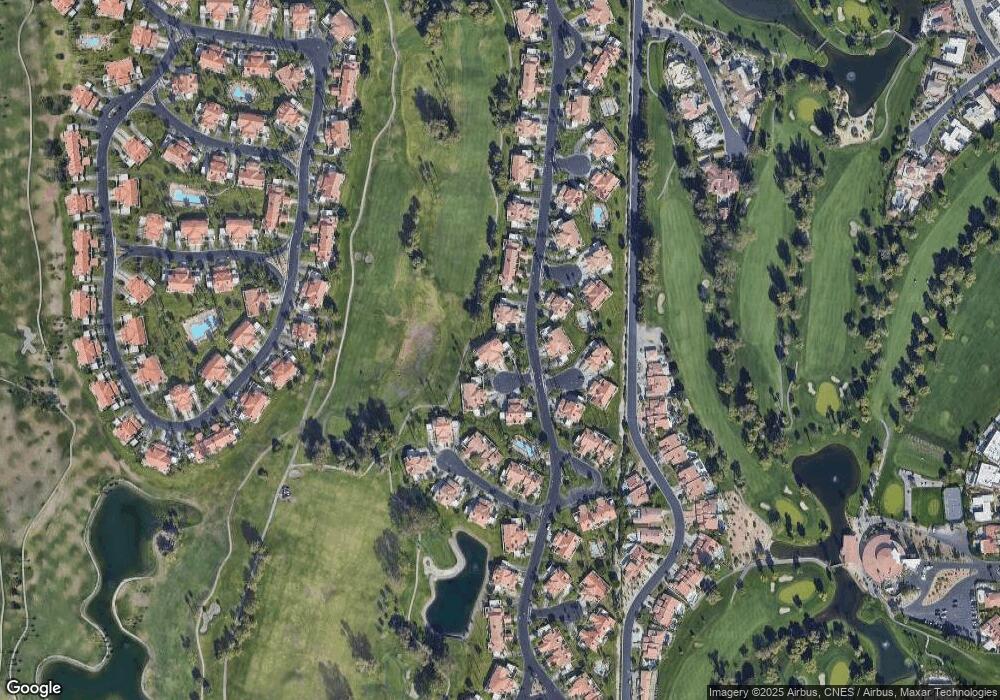
Map
Nearby Homes
- 265 Desert Falls Dr E Unit 4
- 139 Villa Ct
- 292 Desert Falls Dr E Unit 90
- 304 Desert Falls Dr E
- 39141 Sweetwater Dr
- 152 Falls Ct Unit 145
- 272 Vista Royale Cir E
- 237 Vista Royale Cir E
- 239 Vista Royale Cir E
- 191 Desert Falls Cir
- 208 Desert Falls Dr E
- 230 Vista Royale Cir W
- 172 Torrey Pine Dr
- 190 Firestone Dr
- 357 Desert Falls Dr E
- 191 Desert Falls Dr E
- 378 Desert Falls Dr E
- 163 Desert Falls Cir
- 75720 Mclachlin Cir
- 38960 Kilimanjaro Dr
- 281 Desert Falls Dr E
- 277 Desert Falls Dr E
- 275 Desert Falls Dr E
- 261 Desert Falls Dr E
- 285 Desert Falls Dr E
- 283 Desert Falls Dr E
- 289 Desert Falls Dr E
- 287 Desert Falls Dr E
- 273 Desert Falls Dr E
- 271 Desert Falls Dr E
- 269 Desert Falls Dr E
- 267 Desert Falls Dr E Unit 5
- 284 Desert Falls Dr E
- 282 Desert Falls Dr E
- 263 Desert Falls Dr E
- 278 Desert Falls Dr E
- 280 Desert Falls Dr E
- 259 Desert Falls Dr E
- 286 Desert Falls Dr E
- 288 Desert Falls Dr E