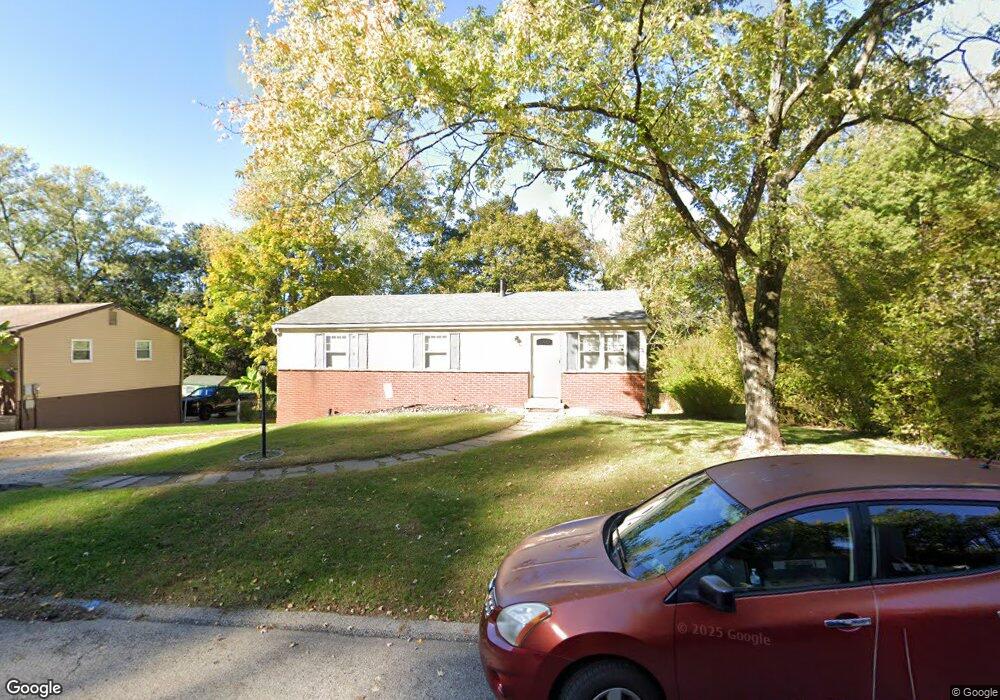
279 Hazel Rd Pittsburgh, PA 15235
Penn Hills Township NeighborhoodEstimated Value: $168,000 - $188,000
3
Beds
1
Bath
1,080
Sq Ft
$168/Sq Ft
Est. Value
About This Home
This home is located at 279 Hazel Rd, Pittsburgh, PA 15235 and is currently estimated at $181,478, approximately $168 per square foot. 279 Hazel Rd is a home located in Allegheny County with nearby schools including Penn Hills Elementary School, Linton Middle School, and Penn Hills Senior High School.
Ownership History
Date
Name
Owned For
Owner Type
Purchase Details
Closed on
Oct 1, 2021
Sold by
Triple Alpha Hghts L L C
Bought by
Cupola Homes27 L L C
Current Estimated Value
Purchase Details
Closed on
Sep 22, 2021
Sold by
Triple Alpha Heights Llc
Bought by
Cupola Homes27 Llc
Purchase Details
Closed on
Jul 19, 2021
Sold by
Triple Alpha Heights Llc
Bought by
Triple Alpha Heights Llc
Purchase Details
Closed on
Jun 22, 2001
Sold by
Richey John A
Bought by
Richey John A and Richey Dianne
Create a Home Valuation Report for This Property
The Home Valuation Report is an in-depth analysis detailing your home's value as well as a comparison with similar homes in the area
Home Values in the Area
Average Home Value in this Area
Purchase History
| Date | Buyer | Sale Price | Title Company |
|---|---|---|---|
| Cupola Homes27 L L C | $152,000 | -- | |
| Cupola Homes27 L L C | $152,000 | -- | |
| Cupola Homes27 Llc | $152,000 | -- | |
| Triple Alpha Heights Llc | $85,000 | -- | |
| Triple Alpha Heights Llc | $85,000 | -- | |
| Triple Alpha Heights Llc | $85,000 | Financial Dimensions Inc | |
| Triple Alpha Hghts L L C | $85,000 | Financial Dimensions Inc | |
| Richey John A | -- | -- |
Source: Public Records
Tax History Compared to Growth
Tax History
| Year | Tax Paid | Tax Assessment Tax Assessment Total Assessment is a certain percentage of the fair market value that is determined by local assessors to be the total taxable value of land and additions on the property. | Land | Improvement |
|---|---|---|---|---|
| 2025 | $4,031 | $96,500 | $12,500 | $84,000 |
| 2024 | $4,031 | $96,500 | $12,500 | $84,000 |
| 2023 | $3,062 | $73,300 | $12,500 | $60,800 |
| 2022 | $3,025 | $73,300 | $12,500 | $60,800 |
| 2021 | $3,025 | $73,300 | $12,500 | $60,800 |
| 2020 | $2,920 | $73,300 | $12,500 | $60,800 |
| 2019 | $2,920 | $73,300 | $12,500 | $60,800 |
| 2018 | $347 | $73,300 | $12,500 | $60,800 |
| 2017 | $2,674 | $73,300 | $12,500 | $60,800 |
| 2016 | $347 | $73,300 | $12,500 | $60,800 |
| 2015 | $347 | $73,300 | $12,500 | $60,800 |
| 2014 | $2,516 | $73,300 | $12,500 | $60,800 |
Source: Public Records
Map
Nearby Homes